Estimated Value: $950,000
2
Beds
1
Bath
1,152
Sq Ft
$825/Sq Ft
Est. Value
About This Home
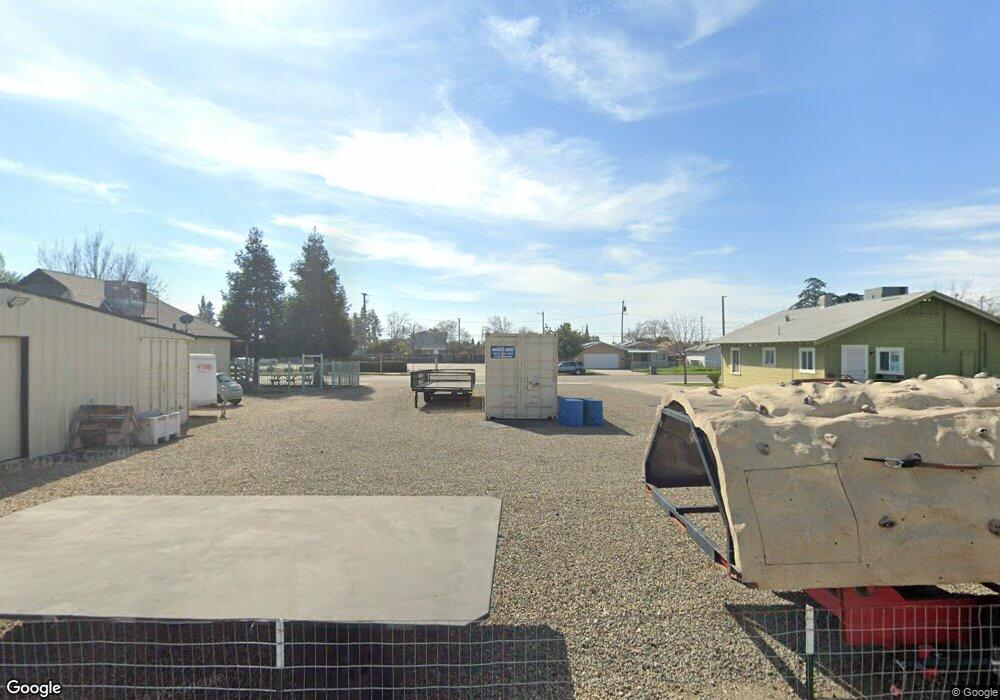
This home is located at 1930 Sylvia St, Selma, CA 93662 and is currently estimated at $950,000, approximately $824 per square foot. 1930 Sylvia St is a home located in Fresno County with nearby schools including James Garfield Elementary School, Abraham Lincoln Middle School, and Selma High School.
Ownership History
Date
Name
Owned For
Owner Type
Purchase Details
Closed on
Mar 6, 2013
Sold by
Gospel Light Baptist Church
Bought by
Jackson Mike
Current Estimated Value
Purchase Details
Closed on
Oct 1, 2011
Sold by
Robinette William
Bought by
California Baptist Foundation
Purchase Details
Closed on
Sep 6, 2006
Sold by
Tucker William W and Tucker Charlotte L
Bought by
Gospel Light Baptist Church
Home Financials for this Owner
Home Financials are based on the most recent Mortgage that was taken out on this home.
Original Mortgage
$411,684
Interest Rate
6.36%
Mortgage Type
Purchase Money Mortgage
Create a Home Valuation Report for This Property
The Home Valuation Report is an in-depth analysis detailing your home's value as well as a comparison with similar homes in the area
Home Values in the Area
Average Home Value in this Area
Purchase History
| Date | Buyer | Sale Price | Title Company |
|---|---|---|---|
| Jackson Mike | $454,929 | Chicago Title Company | |
| California Baptist Foundation | -- | None Available | |
| Gospel Light Baptist Church | $400,000 | Financial Title Company |
Source: Public Records
Mortgage History
| Date | Status | Borrower | Loan Amount |
|---|---|---|---|
| Previous Owner | Gospel Light Baptist Church | $411,684 |
Source: Public Records
Tax History Compared to Growth
Tax History
| Year | Tax Paid | Tax Assessment Tax Assessment Total Assessment is a certain percentage of the fair market value that is determined by local assessors to be the total taxable value of land and additions on the property. | Land | Improvement |
|---|---|---|---|---|
| 2025 | $863 | $24,622 | $24,622 | -- |
| 2023 | $816 | $23,667 | $23,667 | $0 |
| 2022 | $781 | $23,203 | $23,203 | $0 |
| 2021 | $759 | $22,749 | $22,749 | $0 |
| 2020 | $742 | $22,516 | $22,516 | $0 |
| 2019 | $719 | $22,075 | $22,075 | $0 |
| 2018 | $702 | $21,643 | $21,643 | $0 |
| 2017 | $639 | $21,219 | $21,219 | $0 |
| 2016 | $561 | $20,803 | $20,803 | $0 |
| 2015 | $564 | $20,491 | $20,491 | $0 |
| 2014 | $539 | $20,090 | $20,090 | $0 |
Source: Public Records
Map
Nearby Homes