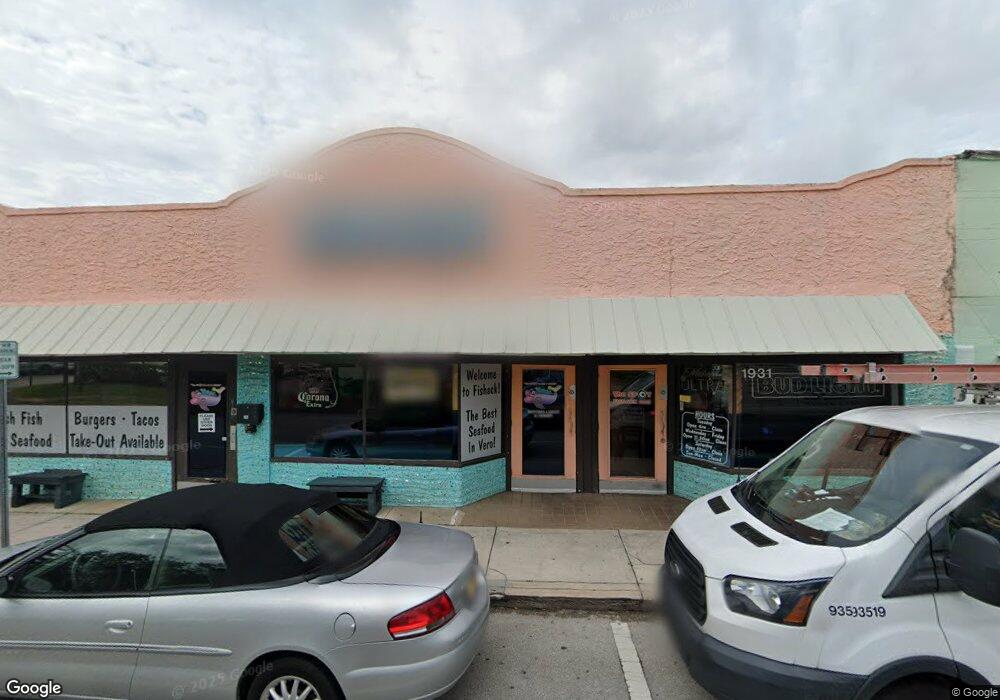
1931 Old Dixie Hwy Vero Beach, FL 32960
Central Vero Beach NeighborhoodEstimated Value: $1,154,617
--
Bed
--
Bath
2,448
Sq Ft
$472/Sq Ft
Est. Value
About This Home
This home is located at 1931 Old Dixie Hwy, Vero Beach, FL 32960 and is currently estimated at $1,154,617, approximately $471 per square foot. 1931 Old Dixie Hwy is a home located in Indian River County with nearby schools including Vero Beach Elementary School, Gifford Middle School, and Vero Beach High School.
Ownership History
Date
Name
Owned For
Owner Type
Purchase Details
Closed on
Apr 9, 2015
Sold by
Harris Properties Llc
Bought by
5 Double Yous Llc
Current Estimated Value
Home Financials for this Owner
Home Financials are based on the most recent Mortgage that was taken out on this home.
Original Mortgage
$476,000
Outstanding Balance
$326,288
Interest Rate
3.89%
Mortgage Type
Commercial
Estimated Equity
$828,329
Purchase Details
Closed on
Jun 27, 2005
Sold by
Dinello John R and Dinello Grace P
Bought by
Harris Properties Llc
Purchase Details
Closed on
Feb 25, 1982
Home Financials for this Owner
Home Financials are based on the most recent Mortgage that was taken out on this home.
Original Mortgage
$37,000
Interest Rate
17.66%
Purchase Details
Closed on
Feb 12, 1981
Home Financials for this Owner
Home Financials are based on the most recent Mortgage that was taken out on this home.
Interest Rate
15%
Create a Home Valuation Report for This Property
The Home Valuation Report is an in-depth analysis detailing your home's value as well as a comparison with similar homes in the area
Home Values in the Area
Average Home Value in this Area
Purchase History
| Date | Buyer | Sale Price | Title Company |
|---|---|---|---|
| 5 Double Yous Llc | $500,000 | Attorney | |
| Harris Properties Llc | $340,000 | Alliance Title East Coast | |
| -- | $27,000 | -- | |
| -- | $57 | -- |
Source: Public Records
Mortgage History
| Date | Status | Borrower | Loan Amount |
|---|---|---|---|
| Open | 5 Double Yous Llc | $476,000 | |
| Previous Owner | -- | $35,650 | |
| Previous Owner | -- | $37,000 | |
| Previous Owner | -- | $6,000 | |
| Previous Owner | -- | -- |
Source: Public Records
Tax History Compared to Growth
Tax History
| Year | Tax Paid | Tax Assessment Tax Assessment Total Assessment is a certain percentage of the fair market value that is determined by local assessors to be the total taxable value of land and additions on the property. | Land | Improvement |
|---|---|---|---|---|
| 2025 | $5,932 | $238,387 | $28,091 | $210,296 |
| 2024 | $5,478 | $234,264 | $28,091 | $206,173 |
| 2023 | $5,478 | $245,379 | $28,091 | $217,288 |
| 2022 | $4,821 | $247,037 | $28,091 | $218,946 |
| 2021 | $4,788 | $248,770 | $28,091 | $220,679 |
| 2020 | $5,161 | $271,806 | $28,091 | $243,715 |
| 2019 | $5,245 | $272,010 | $28,091 | $243,919 |
| 2018 | $5,205 | $266,257 | $28,091 | $238,166 |
| 2017 | $5,280 | $269,335 | $0 | $0 |
| 2016 | $5,801 | $297,940 | $0 | $0 |
| 2015 | $4,627 | $223,070 | $0 | $0 |
| 2014 | $4,284 | $212,030 | $0 | $0 |
Source: Public Records
Map
Nearby Homes
- 1246 17th Place
- 12600 Florida 60
- 1734 14th Ave
- 10555 State Road 60
- 4025 U S Route 1
- 1406 + 1408 36th Ave
- 2146 18th Ave
- 939 19th St
- 1100 Ponce de Leon Cir Unit N208
- 1576 15th Ave
- 5910 24th St
- 9650 24th St
- 9430 24th St
- 1555 14th Ave Unit 209
- 835 18th St Unit 310
- 835 18th St Unit 404
- 1717 20th Ave
- 1841 21st Ave
- 1505 14th Ct
- 1506 16th Ave
- 1925 Old Dixie Hwy
- 1937 Old Dixie Hwy
- 1920 14th Ave
- 1922 14th Ave
- 1932 14th Ave
- 1904 14th Ave
- 1201 19th Place Unit B200C-F
- 1201 19th Place Unit B300
- 1201 19th Place Unit B 400
- 1201 19th Place Unit B 401
- 1201 19th Place Unit B100
- 1201 19th Place Unit A
- 1201 19th Place Unit B
- 1201 19th Place Unit E
- 1201 19th Place Unit F
- 1201 19th Place Unit G
- 1201 19th Place Unit I
- 1201 19th Place Unit H
- 1201 19th Place Unit 2nd floor
- 1201 19th Place Unit B101