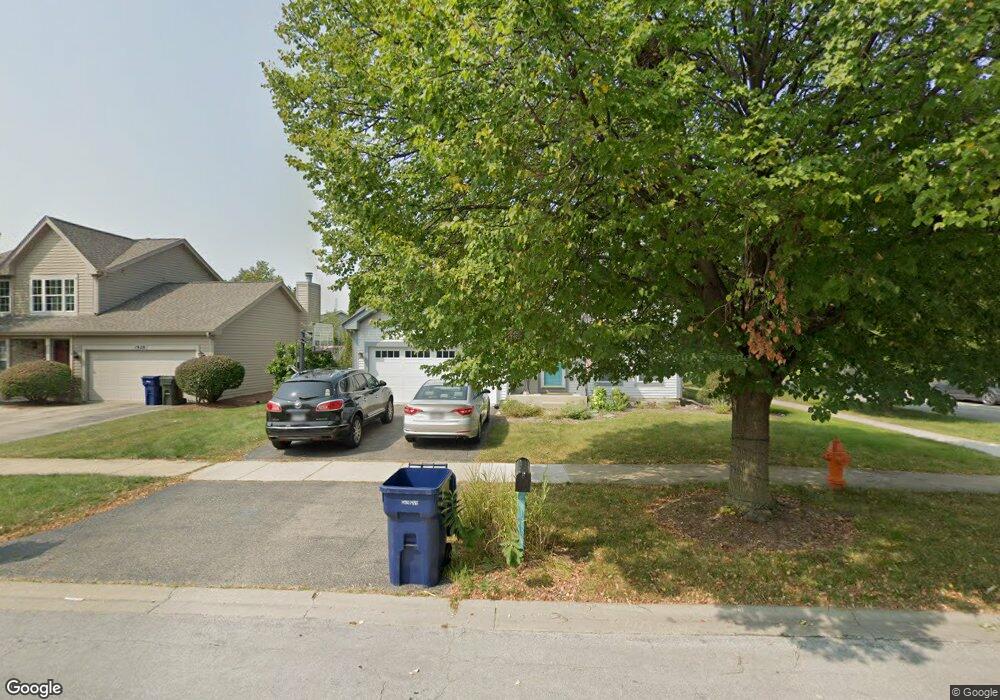
1932 Crossing Ct Unit 1 Naperville, IL 60540
West Sanctuary Lane NeighborhoodEstimated Value: $477,113 - $534,000
3
Beds
2
Baths
1,476
Sq Ft
$344/Sq Ft
Est. Value
About This Home
This home is located at 1932 Crossing Ct Unit 1, Naperville, IL 60540 and is currently estimated at $507,028, approximately $343 per square foot. 1932 Crossing Ct Unit 1 is a home located in DuPage County with nearby schools including Mary Lou Cowlishaw Elementary School, Still Middle School, and Metea Valley High School.
Ownership History
Date
Name
Owned For
Owner Type
Purchase Details
Closed on
Jul 27, 2011
Sold by
Stanton Sarah J
Bought by
Collins Erin
Current Estimated Value
Home Financials for this Owner
Home Financials are based on the most recent Mortgage that was taken out on this home.
Original Mortgage
$228,400
Outstanding Balance
$157,846
Interest Rate
4.53%
Mortgage Type
New Conventional
Estimated Equity
$349,182
Purchase Details
Closed on
Jul 20, 2006
Sold by
Stanton Sarah J and Stanton Christopher N
Bought by
Stanton Sarah J
Purchase Details
Closed on
Jun 27, 2002
Sold by
Prada Jorge O and Prada Ana M
Bought by
Stanton Chris and Stanton Sarah J
Home Financials for this Owner
Home Financials are based on the most recent Mortgage that was taken out on this home.
Original Mortgage
$168,000
Interest Rate
6.8%
Purchase Details
Closed on
Nov 17, 1997
Sold by
Lakewood Homes Inc
Bought by
Prada Jorge O and Prada Ana M
Home Financials for this Owner
Home Financials are based on the most recent Mortgage that was taken out on this home.
Original Mortgage
$155,726
Interest Rate
7.35%
Mortgage Type
FHA
Create a Home Valuation Report for This Property
The Home Valuation Report is an in-depth analysis detailing your home's value as well as a comparison with similar homes in the area
Home Values in the Area
Average Home Value in this Area
Purchase History
| Date | Buyer | Sale Price | Title Company |
|---|---|---|---|
| Collins Erin | $246,500 | Attorneys Title Guaranty Fun | |
| Stanton Sarah J | -- | None Available | |
| Stanton Chris | $210,000 | -- | |
| Prada Jorge O | $162,500 | -- |
Source: Public Records
Mortgage History
| Date | Status | Borrower | Loan Amount |
|---|---|---|---|
| Open | Collins Erin | $228,400 | |
| Previous Owner | Stanton Chris | $168,000 | |
| Previous Owner | Prada Jorge O | $155,726 | |
| Closed | Stanton Chris | $20,975 |
Source: Public Records
Tax History Compared to Growth
Tax History
| Year | Tax Paid | Tax Assessment Tax Assessment Total Assessment is a certain percentage of the fair market value that is determined by local assessors to be the total taxable value of land and additions on the property. | Land | Improvement |
|---|---|---|---|---|
| 2024 | $7,495 | $128,072 | $42,279 | $85,793 |
| 2023 | $7,160 | $115,080 | $37,990 | $77,090 |
| 2022 | $6,981 | $108,150 | $35,450 | $72,700 |
| 2021 | $6,756 | $104,290 | $34,180 | $70,110 |
| 2020 | $6,747 | $104,290 | $34,180 | $70,110 |
| 2019 | $6,475 | $99,190 | $32,510 | $66,680 |
| 2018 | $6,199 | $93,570 | $30,460 | $63,110 |
| 2017 | $6,023 | $90,400 | $29,430 | $60,970 |
| 2016 | $5,907 | $86,750 | $28,240 | $58,510 |
| 2015 | $5,843 | $82,360 | $26,810 | $55,550 |
| 2014 | $5,719 | $78,150 | $25,260 | $52,890 |
| 2013 | $5,707 | $78,690 | $25,430 | $53,260 |
Source: Public Records
Map
Nearby Homes
- 891 Lowell Ln
- 2459 Emerson Ln
- 2809 Blakely Ln Unit 24
- 2783 Blakely Ln Unit 34
- 822 Shandrew Dr Unit 103
- 1262 Rhodes Ln Unit 2701
- 1208 Tennyson Ln
- 1114 Tennyson Ln
- 1259 Natchez Trace Cir
- 856 Cardiff Rd
- 7S410 Arbor Dr
- 4177 Irving Rd
- 4328 Chelsea Manor Cir
- 4138 Irving Rd
- 4118 Calder Ln
- 134 S Whispering Hills Dr
- 4515 Chelsea Manor Cir
- 4511 Chelsea Manor Cir
- Danbury II Plan at Chelsea Manor - Charlestown Series
- Ainslie Plan at Chelsea Manor - Charlestown Series
- 1928 Crossing Ct
- 2004 Crossing Ln
- 1924 Crossing Ct
- 2012 Three Farms Ave
- 1931 Crossing Ct
- 1132 Hannah Ct
- 1927 Crossing Ct
- 2008 Crossing Ln
- 1920 Crossing Ct
- 2003 Crossing Ln
- 2016 Three Farms Ave
- 1923 Crossing Ct
- 1128 Hannah Ct
- 1919 Crossing Ct
- 2012 Crossing Ln
- 2007 Crossing Ln
- 1916 Crossing Ct
- 1131 Hannah Ct
- 1124 Hannah Ct
- 2011 Crossing Ln