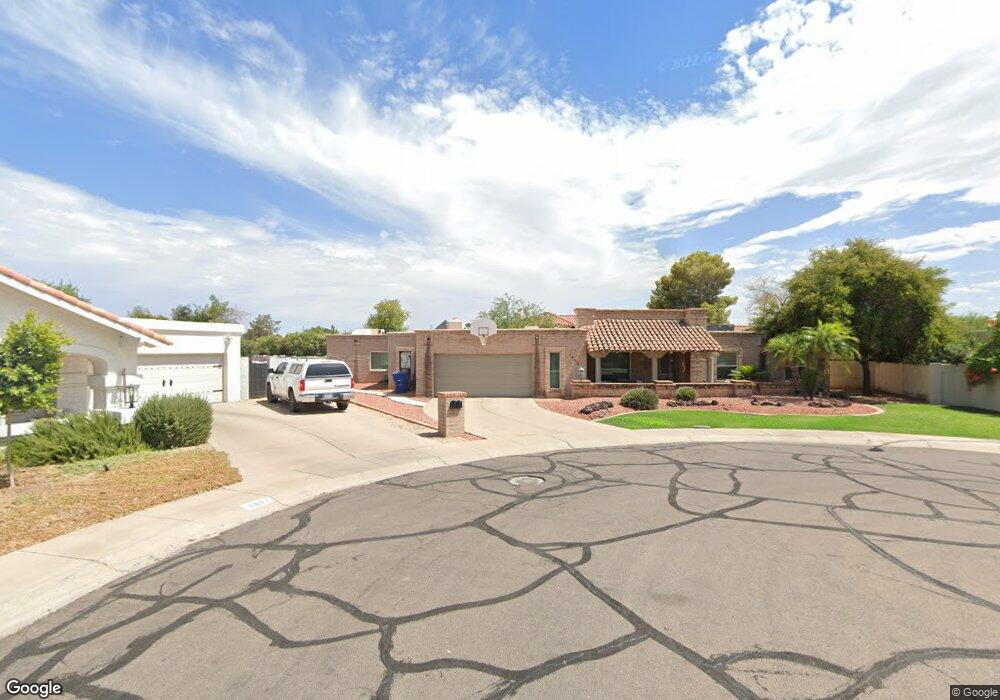
1933 E Redmon Dr Tempe, AZ 85283
South Tempe NeighborhoodEstimated Value: $644,000 - $847,000
Studio
3
Baths
2,917
Sq Ft
$261/Sq Ft
Est. Value
About This Home
This home is located at 1933 E Redmon Dr, Tempe, AZ 85283 and is currently estimated at $761,777, approximately $261 per square foot. 1933 E Redmon Dr is a home located in Maricopa County with nearby schools including Kyrene del Norte School, Kyrene de los Niños Elementary School, and Kyrene Middle School.
Ownership History
Date
Name
Owned For
Owner Type
Purchase Details
Closed on
Nov 22, 2017
Sold by
Alegre Regina
Bought by
Alegre Regina
Current Estimated Value
Home Financials for this Owner
Home Financials are based on the most recent Mortgage that was taken out on this home.
Original Mortgage
$90,527
Interest Rate
3.94%
Mortgage Type
New Conventional
Purchase Details
Closed on
Jun 18, 2003
Sold by
Strander Thomas C
Bought by
Strander T C and Strander Alegre R
Home Financials for this Owner
Home Financials are based on the most recent Mortgage that was taken out on this home.
Original Mortgage
$75,000
Interest Rate
5.26%
Mortgage Type
Credit Line Revolving
Purchase Details
Closed on
Mar 30, 2000
Sold by
Strander T C and Strander Alegre R
Bought by
Strander T C and Strander Alegre R
Create a Home Valuation Report for This Property
The Home Valuation Report is an in-depth analysis detailing your home's value as well as a comparison with similar homes in the area
Home Values in the Area
Average Home Value in this Area
Purchase History
| Date | Buyer | Sale Price | Title Company |
|---|---|---|---|
| Alegre Regina | -- | First American Title Insuran | |
| Strander T C | -- | Security Title Agency | |
| Strander Thomas C | -- | Security Title Agency | |
| Strander Thomas C | -- | Security Title Agency | |
| Strander T C | -- | -- | |
| Strander T C | -- | -- |
Source: Public Records
Mortgage History
| Date | Status | Borrower | Loan Amount |
|---|---|---|---|
| Closed | Alegre Regina | $90,527 | |
| Closed | Strander Thomas C | $75,000 | |
| Closed | Strander Thomas C | $113,000 |
Source: Public Records
Tax History
| Year | Tax Paid | Tax Assessment Tax Assessment Total Assessment is a certain percentage of the fair market value that is determined by local assessors to be the total taxable value of land and additions on the property. | Land | Improvement |
|---|---|---|---|---|
| 2025 | $4,139 | $43,460 | -- | -- |
| 2024 | $3,881 | $41,390 | -- | -- |
| 2023 | $3,881 | $60,570 | $12,110 | $48,460 |
| 2022 | $3,674 | $45,320 | $9,060 | $36,260 |
| 2021 | $3,772 | $42,060 | $8,410 | $33,650 |
| 2020 | $3,682 | $40,570 | $8,110 | $32,460 |
| 2019 | $3,566 | $37,850 | $7,570 | $30,280 |
| 2018 | $3,446 | $35,620 | $7,120 | $28,500 |
| 2017 | $3,303 | $33,930 | $6,780 | $27,150 |
| 2016 | $3,350 | $34,620 | $6,920 | $27,700 |
| 2015 | $3,095 | $31,160 | $6,230 | $24,930 |
Source: Public Records
Map
Nearby Homes
- 6517 S Hazelton Ln
- 1947 E Orion St
- 2021 E Pegasus Dr
- 2031 E Vaughn St
- 1915 E Gemini Dr Unit 6
- 2101 E Vaughn St
- 1938 E Diamond Dr
- 6411 S River Dr Unit 6
- 1943 E Diamond Dr
- 6320 S Shannon Dr Unit 9
- 6008 S Mcclintock Dr
- 1701 E Julie Dr
- 1919 E Auburn Dr
- 1831 E Cornell Dr
- 5807 S Alder Dr
- 1823 E Cornell Dr Unit 11
- 5817 S Siesta Ln
- 1402 E Guadalupe Rd Unit 153
- 1402 E Guadalupe Rd Unit 149
- 6815 S Juniper St
- 1935 E Redmon Dr
- 1927 E Redmon Dr
- 1934 E Redmon Dr
- 1934 E Woodman Dr
- 1932 E Redmon Dr
- 1929 E Redmon Dr
- 1928 E Woodman Dr
- 1936 E Redmon Dr
- 1933 E Woodman Dr
- 1928 E Redmon Dr
- 1930 E Redmon Dr
- 1945 E Guadalupe Rd Unit 3
- 1927 E Woodman Dr
- 1935 E Woodman Dr
- 1921 E Woodman Dr
- 1913 E Redmon Dr
- 6506 S Kenwood Ln
- 1939 E Woodman Dr
- 1940 E Vaughn St
- 1934 E Vaughn St
Your Personal Tour Guide
Ask me questions while you tour the home.