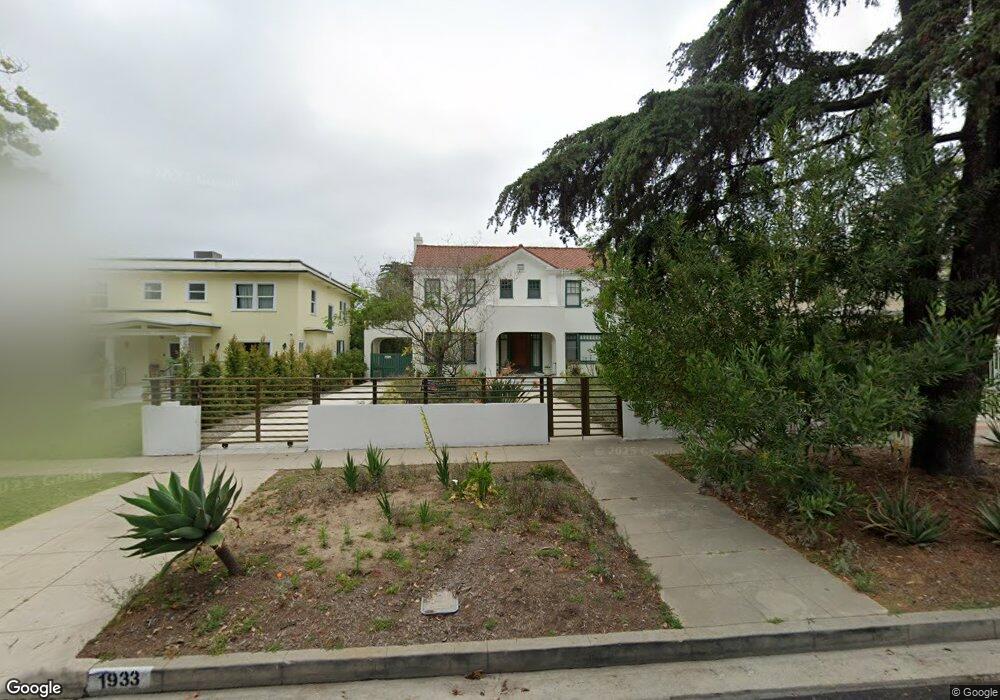
1933 S Victoria Ave Los Angeles, CA 90016
Mid-City NeighborhoodEstimated Value: $1,595,000 - $1,900,000
5
Beds
3
Baths
2,540
Sq Ft
$691/Sq Ft
Est. Value
About This Home
This home is located at 1933 S Victoria Ave, Los Angeles, CA 90016 and is currently estimated at $1,756,068, approximately $691 per square foot. 1933 S Victoria Ave is a home located in Los Angeles County with nearby schools including Alta Loma Elementary, Johnnie L. Cochran Jr. Middle School, and Los Angeles Senior High School.
Ownership History
Date
Name
Owned For
Owner Type
Purchase Details
Closed on
Sep 13, 2010
Sold by
Power Mary R and Hernandez Librada
Bought by
Power Mary R and Hernandez Librada
Current Estimated Value
Purchase Details
Closed on
Oct 19, 2005
Sold by
Powers Mary R and Hernandez Librada
Bought by
Power Mary R and Hernandez Librada
Home Financials for this Owner
Home Financials are based on the most recent Mortgage that was taken out on this home.
Original Mortgage
$115,000
Interest Rate
5.68%
Mortgage Type
Stand Alone Second
Purchase Details
Closed on
Sep 27, 2005
Sold by
Royce Linda S and Estate Of Mildred L Morris
Bought by
Powets Mary R and Hernandez Librada
Home Financials for this Owner
Home Financials are based on the most recent Mortgage that was taken out on this home.
Original Mortgage
$115,000
Interest Rate
5.68%
Mortgage Type
Stand Alone Second
Create a Home Valuation Report for This Property
The Home Valuation Report is an in-depth analysis detailing your home's value as well as a comparison with similar homes in the area
Home Values in the Area
Average Home Value in this Area
Purchase History
| Date | Buyer | Sale Price | Title Company |
|---|---|---|---|
| Power Mary R | -- | None Available | |
| Power Mary R | -- | Fidelity National Title Co | |
| Powets Mary R | $850,000 | -- |
Source: Public Records
Mortgage History
| Date | Status | Borrower | Loan Amount |
|---|---|---|---|
| Closed | Power Mary R | $115,000 | |
| Open | Powets Mary R | $650,000 |
Source: Public Records
Tax History Compared to Growth
Tax History
| Year | Tax Paid | Tax Assessment Tax Assessment Total Assessment is a certain percentage of the fair market value that is determined by local assessors to be the total taxable value of land and additions on the property. | Land | Improvement |
|---|---|---|---|---|
| 2025 | $13,996 | $1,161,579 | $929,268 | $232,311 |
| 2024 | $13,996 | $1,138,804 | $911,048 | $227,756 |
| 2023 | $13,728 | $1,116,476 | $893,185 | $223,291 |
| 2022 | $13,095 | $1,094,585 | $875,672 | $218,913 |
| 2021 | $12,926 | $1,073,123 | $858,502 | $214,621 |
| 2019 | $12,540 | $1,041,296 | $833,040 | $208,256 |
| 2018 | $12,444 | $1,020,879 | $816,706 | $204,173 |
| 2016 | $11,891 | $981,240 | $784,994 | $196,246 |
| 2015 | $10,566 | $870,000 | $664,000 | $206,000 |
| 2014 | $10,811 | $870,000 | $664,000 | $206,000 |
Source: Public Records
Map
Nearby Homes
- 2125 Crenshaw Blvd
- 2009 S Victoria Ave
- 1929 Crenshaw Blvd
- 2111 S Bronson Ave
- 1947 S Bronson Ave
- 2311 Crenshaw Blvd
- 2136 S Victoria Ave
- 1931 Buckingham Rd
- 2308 11th Ave
- 1685 S Victoria Ave
- 1746 Crenshaw Blvd
- 4512 St Elmo Dr
- 2516 13th Ave
- 4522 Saint Elmo Dr
- 2025 West Blvd
- 2413 S Victoria Ave
- 2011 8th Ave
- 2546 S Bronson Ave
- 2209 West Blvd
- 2102 Hillcrest Dr
- 1939 S Victoria Ave
- 1927 S Victoria Ave
- 1921 S Victoria Ave
- 1945 S Victoria Ave
- 1920 Wellington Rd
- 1914 Wellington Rd
- 1926 Wellington Rd
- 1908 Wellington Rd
- 1951 S Victoria Ave
- 1932 Wellington Rd
- 1905 S Victoria Ave
- 1902 Wellington Rd Unit 6
- 1902 Wellington Rd
- 1932 S Victoria Ave
- 1938 S Victoria Ave
- 1957 S Victoria Ave
- 1926 S Victoria Ave
- 1944 S Victoria Ave
- 1938 Wellington Rd
- 1920 S Victoria Ave