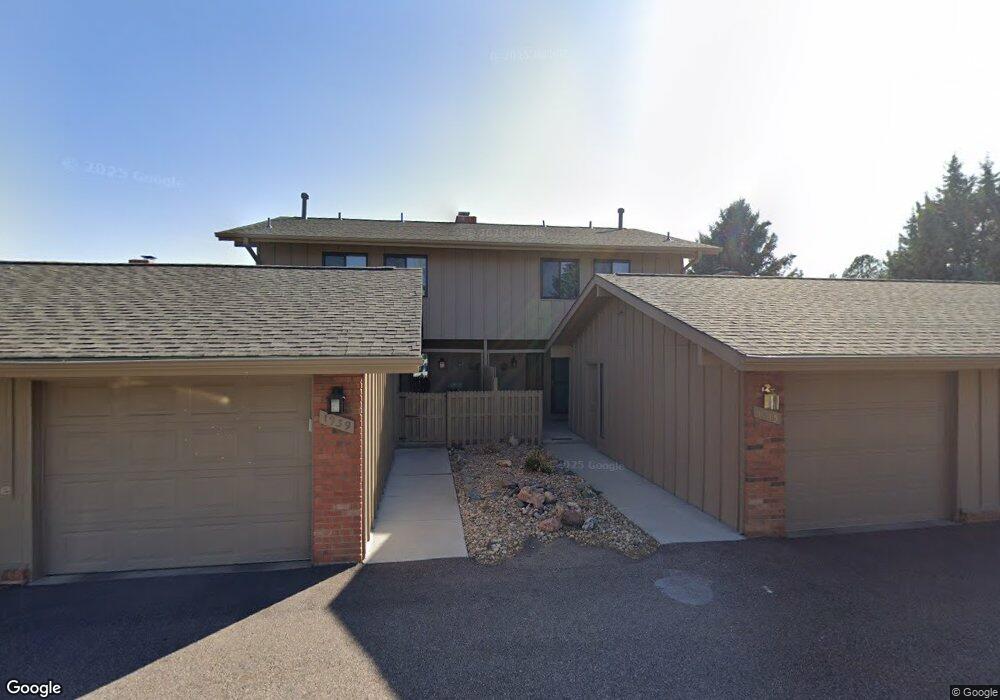
1935 Kedron Dr Fort Collins, CO 80524
Estimated Value: $399,000 - $504,000
3
Beds
4
Baths
1,788
Sq Ft
$244/Sq Ft
Est. Value
About This Home
This home is located at 1935 Kedron Dr, Fort Collins, CO 80524 and is currently estimated at $436,143, approximately $243 per square foot. 1935 Kedron Dr is a home located in Larimer County with nearby schools including Tavelli Elementary School, Lincoln Middle School, and Poudre High School.
Ownership History
Date
Name
Owned For
Owner Type
Purchase Details
Closed on
Dec 14, 2017
Sold by
Draper Daniel
Bought by
Pfiffner Tom and Pfiffner Laurie
Current Estimated Value
Purchase Details
Closed on
Feb 18, 2016
Sold by
Mchugh Matthew and Mchugh Erin
Bought by
Draper Daniel
Home Financials for this Owner
Home Financials are based on the most recent Mortgage that was taken out on this home.
Original Mortgage
$278,910
Interest Rate
3.81%
Mortgage Type
VA
Purchase Details
Closed on
Sep 29, 2009
Sold by
Hopkins Tyson T
Bought by
Mchugh Matthew and Mchugh Erin
Home Financials for this Owner
Home Financials are based on the most recent Mortgage that was taken out on this home.
Original Mortgage
$132,454
Interest Rate
5.16%
Mortgage Type
FHA
Purchase Details
Closed on
Jan 1, 1994
Sold by
Atchison Scharee Lee
Bought by
Hopkins Dolores D
Create a Home Valuation Report for This Property
The Home Valuation Report is an in-depth analysis detailing your home's value as well as a comparison with similar homes in the area
Home Values in the Area
Average Home Value in this Area
Purchase History
| Date | Buyer | Sale Price | Title Company |
|---|---|---|---|
| Pfiffner Tom | $285,500 | Heritage Title Co | |
| Draper Daniel | $270,000 | North American Title | |
| Mchugh Matthew | $134,900 | Unified Title Company | |
| Hopkins Dolores D | $97,000 | -- |
Source: Public Records
Mortgage History
| Date | Status | Borrower | Loan Amount |
|---|---|---|---|
| Previous Owner | Draper Daniel | $278,910 | |
| Previous Owner | Mchugh Matthew | $132,454 |
Source: Public Records
Tax History Compared to Growth
Tax History
| Year | Tax Paid | Tax Assessment Tax Assessment Total Assessment is a certain percentage of the fair market value that is determined by local assessors to be the total taxable value of land and additions on the property. | Land | Improvement |
|---|---|---|---|---|
| 2025 | $2,057 | $24,851 | $1,434 | $23,417 |
| 2024 | $1,959 | $24,851 | $1,434 | $23,417 |
| 2022 | $2,110 | $22,101 | $1,487 | $20,614 |
| 2021 | $2,128 | $22,737 | $1,530 | $21,207 |
| 2020 | $2,037 | $21,579 | $1,530 | $20,049 |
| 2019 | $2,046 | $21,579 | $1,530 | $20,049 |
| 2018 | $1,484 | $16,143 | $1,541 | $14,602 |
| 2017 | $1,479 | $16,143 | $1,541 | $14,602 |
| 2016 | $1,262 | $13,699 | $1,703 | $11,996 |
| 2015 | $1,253 | $13,700 | $1,700 | $12,000 |
| 2014 | $1,030 | $11,190 | $1,700 | $9,490 |
Source: Public Records
Map
Nearby Homes
- 1604 Heber Dr
- 1545 Adriel Ct Unit 1545
- 1508 Linden Lake Rd
- 1643 Adriel Dr Unit 1643
- 1311 S View Cir
- 2126 Friar Tuck Ct
- 2221 Chesapeake Dr
- 2150 Sherwood Forest Ct
- 1412 Wimbledon Ct
- 1614 Hillside Dr
- 1300 Steeplechase Dr
- 2327 Sunbury Ln
- 2305 Turnberry Rd
- 1328 Hillside Dr
- 2146 Walbridge Rd
- 2234 Walbridge Rd
- 2279 E Suniga Rd
- 2285 E Suniga Rd
- 2291 E Suniga Rd
- 2297 E Suniga Rd
- 1939 Kedron Dr Unit 1939
- 1948 Kedron Ct Unit 1948
- 1916 Kedron Dr
- 1944 Kedron Ct
- 1933 Kedron Dr Unit 1933
- 1636 Heber Dr
- 1912 Kedron Dr
- 1935 Kedron Cir
- 1943 Kedron Cir
- 1940 Kedron Ct Unit 1940
- 1939 Kedron Cir
- 1908 Kedron Dr Unit 1908
- 1936 Kedron Ct
- 1640 Heber Dr Unit 1640
- 1632 Heber Dr
- 1620 Heber Dr Unit 1620
- 1628 Heber Dr
- 1904 Kedron Dr
- 1904 Kedron Cir
- 1624 Heber Dr