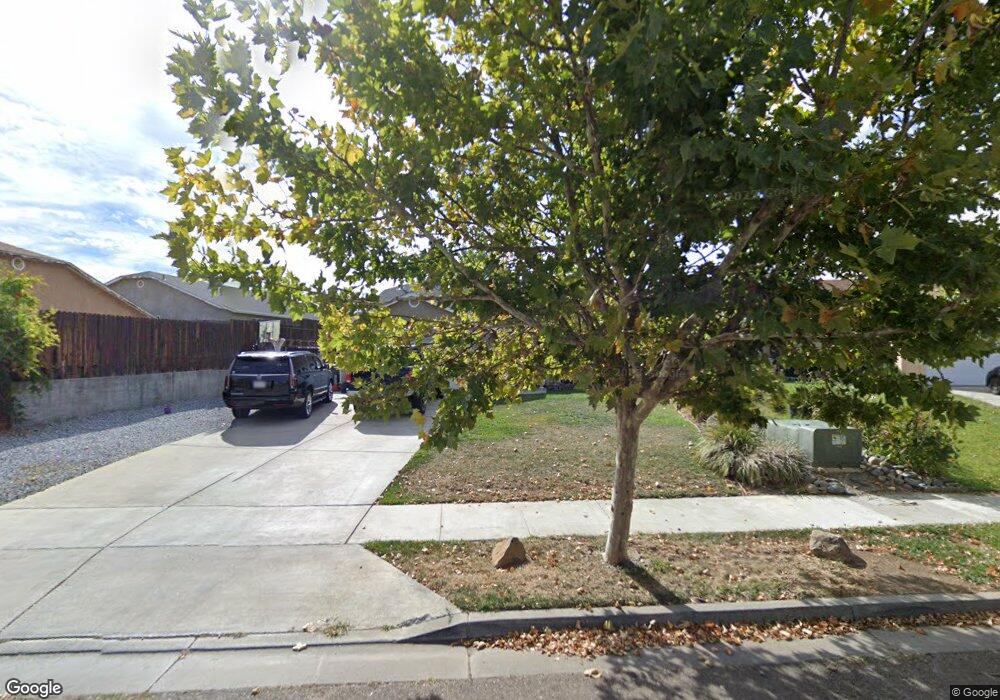
1935 Winchell Ct Red Bluff, CA 96080
Estimated Value: $323,000 - $331,000
5
Beds
2
Baths
1,491
Sq Ft
$219/Sq Ft
Est. Value
About This Home
This home is located at 1935 Winchell Ct, Red Bluff, CA 96080 and is currently estimated at $326,704, approximately $219 per square foot. 1935 Winchell Ct is a home located in Tehama County with nearby schools including Jackson Heights Elementary School, Vista Preparatory Academy, and Red Bluff High School.
Ownership History
Date
Name
Owned For
Owner Type
Purchase Details
Closed on
Jul 7, 2020
Sold by
Byrant Justin
Bought by
Bryant Jamie J
Current Estimated Value
Home Financials for this Owner
Home Financials are based on the most recent Mortgage that was taken out on this home.
Original Mortgage
$199,500
Outstanding Balance
$175,318
Interest Rate
3.1%
Mortgage Type
New Conventional
Estimated Equity
$151,386
Purchase Details
Closed on
May 16, 2006
Sold by
Community Housing Improvement Program In
Bought by
Bryant Justin and Mcfadyen Jamie
Home Financials for this Owner
Home Financials are based on the most recent Mortgage that was taken out on this home.
Original Mortgage
$167,900
Interest Rate
6.41%
Mortgage Type
Purchase Money Mortgage
Create a Home Valuation Report for This Property
The Home Valuation Report is an in-depth analysis detailing your home's value as well as a comparison with similar homes in the area
Purchase History
| Date | Buyer | Sale Price | Title Company |
|---|---|---|---|
| Bryant Jamie J | -- | Chicago Title Company | |
| Bryant Justin | $55,000 | Northern California Title Co |
Source: Public Records
Mortgage History
| Date | Status | Borrower | Loan Amount |
|---|---|---|---|
| Open | Bryant Jamie J | $199,500 | |
| Closed | Bryant Justin | $167,900 |
Source: Public Records
Tax History
| Year | Tax Paid | Tax Assessment Tax Assessment Total Assessment is a certain percentage of the fair market value that is determined by local assessors to be the total taxable value of land and additions on the property. | Land | Improvement |
|---|---|---|---|---|
| 2025 | $2,421 | $240,585 | $53,076 | $187,509 |
| 2023 | $2,428 | $240,585 | $53,076 | $187,509 |
| 2022 | $2,460 | $240,585 | $53,076 | $187,509 |
| 2021 | $2,183 | $218,714 | $48,251 | $170,463 |
| 2020 | $1,949 | $190,186 | $41,957 | $148,229 |
| 2019 | $1,902 | $181,129 | $39,959 | $141,170 |
| 2018 | $1,625 | $164,662 | $36,326 | $128,336 |
| 2017 | $1,514 | $149,693 | $33,024 | $116,669 |
| 2016 | $1,371 | $142,564 | $31,451 | $111,113 |
| 2015 | $1,370 | $142,564 | $31,451 | $111,113 |
| 2014 | $1,189 | $123,969 | $27,349 | $96,620 |
Source: Public Records
Map
Nearby Homes
- 0 Ludlow Ave Unit SN25045951
- 1715 Walbridge St
- 1720 Luning St
- 1710 Luning St
- 1707 Luning St
- 1500 Walbridge St
- 1835 Douglass St
- 1570 Douglass St
- 1356 Park Ave
- 0 Derby Unit 24724349
- 1549 Jackson St
- 1359 2nd St
- 1426 Lincoln St
- 106 Treasure Dr
- 1313 Jackson St
- 147 Treasure Dr
- 605 Breckenridge St
- Lot D Aloe Place
- 1158 Madison St
- 927 Cedar St
- 1945 Winchell Ct
- 1925 Winchell Ct
- 1955 Winchell Ct
- 1745 Ludlow Ave
- 1960 Gentry Way
- 1950 Gentry Way
- 1970 Gentry Way
- 1940 Winchell Ct
- 1960 Winchell Ct
- 1805 Ludlow Ave
- 1965 Winchell Ct
- 2010 Gentry Way
- 2020 Gentry Way
- 1815 Ludlow Ave
- 1975 Winchell Ct
- 1970 Winchell Ct
- 1955 Gentry Way
- 1945 Gentry Way
- 2030 Gentry Way
- 1965 Gentry Way
Your Personal Tour Guide
Ask me questions while you tour the home.