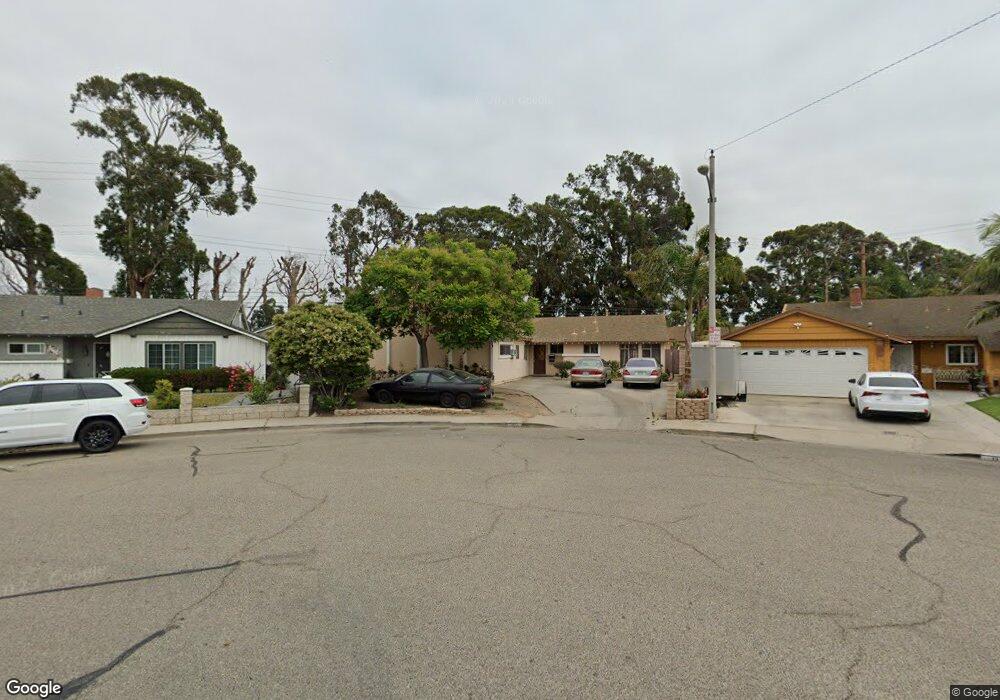
1936 Arcadia St Oxnard, CA 93033
Cal-Gisler NeighborhoodEstimated Value: $698,000 - $888,000
3
Beds
3
Baths
2,312
Sq Ft
$353/Sq Ft
Est. Value
About This Home
This home is located at 1936 Arcadia St, Oxnard, CA 93033 and is currently estimated at $816,461, approximately $353 per square foot. 1936 Arcadia St is a home located in Ventura County with nearby schools including Harrington Elementary School, R.J. Frank Academy of Marine Science & Engineering, and Santa Clara High School.
Ownership History
Date
Name
Owned For
Owner Type
Purchase Details
Closed on
Jun 23, 2017
Sold by
Manrique Meraly
Bought by
Manrique Oliverio
Current Estimated Value
Purchase Details
Closed on
Jun 3, 2017
Sold by
Manrique Isabel
Bought by
Manrique Oliverio
Purchase Details
Closed on
Oct 26, 2011
Sold by
Manrique Oliverio and Manrique Isabel
Bought by
The Bank Of New York Mellon
Purchase Details
Closed on
Feb 18, 2010
Sold by
Manrique Oliverio and Manrique Isabel
Bought by
The Bank Of New York Mellon
Purchase Details
Closed on
Aug 23, 1994
Sold by
Varley Robert D and Varley Audrey M
Bought by
Manrique Oliverio and Manrique Isabel
Home Financials for this Owner
Home Financials are based on the most recent Mortgage that was taken out on this home.
Original Mortgage
$135,000
Interest Rate
8.5%
Create a Home Valuation Report for This Property
The Home Valuation Report is an in-depth analysis detailing your home's value as well as a comparison with similar homes in the area
Home Values in the Area
Average Home Value in this Area
Purchase History
| Date | Buyer | Sale Price | Title Company |
|---|---|---|---|
| Manrique Oliverio | -- | None Available | |
| Manrique Oliverio | -- | None Available | |
| The Bank Of New York Mellon | $225,000 | Landsafe Title | |
| The Bank Of New York Mellon | $245,250 | Landsafe Title | |
| Manrique Oliverio | $156,000 | Chicago Title Co |
Source: Public Records
Mortgage History
| Date | Status | Borrower | Loan Amount |
|---|---|---|---|
| Previous Owner | Manrique Oliverio | $135,000 |
Source: Public Records
Tax History
| Year | Tax Paid | Tax Assessment Tax Assessment Total Assessment is a certain percentage of the fair market value that is determined by local assessors to be the total taxable value of land and additions on the property. | Land | Improvement |
|---|---|---|---|---|
| 2025 | $3,709 | $309,834 | $104,799 | $205,035 |
| 2024 | $3,709 | $303,759 | $102,744 | $201,015 |
| 2023 | $3,573 | $297,803 | $100,729 | $197,074 |
| 2022 | $3,465 | $291,964 | $98,754 | $193,210 |
| 2021 | $3,520 | $286,240 | $96,818 | $189,422 |
| 2020 | $3,585 | $283,307 | $95,826 | $187,481 |
| 2019 | $3,485 | $277,753 | $93,948 | $183,805 |
| 2018 | $3,436 | $272,307 | $92,106 | $180,201 |
| 2017 | $3,263 | $266,968 | $90,300 | $176,668 |
| 2016 | $3,150 | $261,734 | $88,530 | $173,204 |
| 2015 | $3,183 | $257,804 | $87,201 | $170,603 |
| 2014 | $3,148 | $320,708 | $160,354 | $160,354 |
Source: Public Records
Map
Nearby Homes
- 3130 Paula St
- 225 W Iris St
- 3151 Fournier St
- 2151 E Wooley Rd
- 1928 San Benito St
- 1239 S C St
- 2024 S J St
- 1127 S C St
- 860 Morro Way
- 3631 La Costa Place
- 865 S B St Unit Q1
- 360 Ibsen Place Unit 129
- 819 S B St Unit 34
- 3638 S B St
- 633 Meta St
- 140 Gaviota Place Unit 157
- 4160 Petit Dr Unit 39
- 320 Columbia Place Unit 46
- 280 Columbia Place Unit 48
- 1030 Ilena St
- 656 E Hemlock St
- 1928 Arcadia St
- 648 E Hemlock St
- 1918 Arcadia St
- 633 E Iris St
- 638 E Hemlock St
- 1908 Arcadia St
- 629 E Iris St
- 637 E Iris St
- 628 E Hemlock St
- 1900 Arcadia St
- 623 E Iris St
- 618 E Hemlock St
- 619 E Iris St
- 1840 Arcadia St
- 2104 Arcadia St
- 628 E Iris St
- 608 E Hemlock St
- 613 E Iris St
- 1830 Arcadia St
Your Personal Tour Guide
Ask me questions while you tour the home.