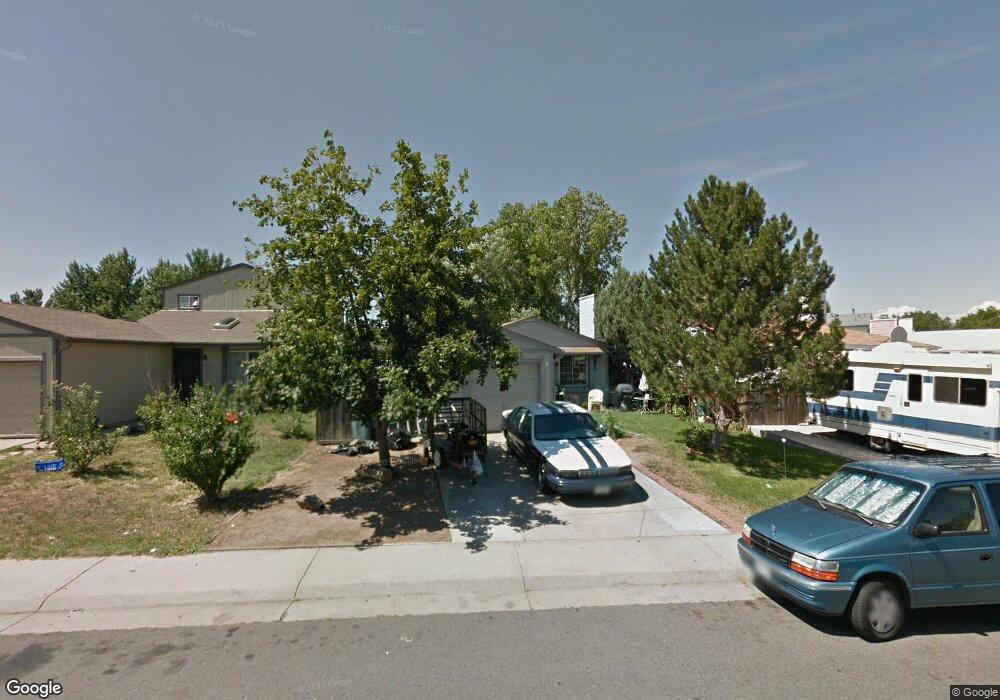
19368 E Batavia Dr Aurora, CO 80011
Tower Triangle NeighborhoodEstimated Value: $388,574 - $416,000
3
Beds
2
Baths
768
Sq Ft
$525/Sq Ft
Est. Value
About This Home
This home is located at 19368 E Batavia Dr, Aurora, CO 80011 and is currently estimated at $403,144, approximately $524 per square foot. 19368 E Batavia Dr is a home located in Adams County with nearby schools including Clyde Miller K-8, Vista Peak 9-12 Preparatory, and KIPP Northeast Elementary.
Ownership History
Date
Name
Owned For
Owner Type
Purchase Details
Closed on
Apr 16, 2001
Sold by
Jeanmenne Renee M
Bought by
Calvillo Santos and Calvillo Irma
Current Estimated Value
Home Financials for this Owner
Home Financials are based on the most recent Mortgage that was taken out on this home.
Original Mortgage
$157,528
Outstanding Balance
$54,659
Interest Rate
6.89%
Mortgage Type
FHA
Estimated Equity
$348,485
Purchase Details
Closed on
Dec 18, 1998
Sold by
Haskins Dwane P
Bought by
Jeanmenne Renee M
Home Financials for this Owner
Home Financials are based on the most recent Mortgage that was taken out on this home.
Original Mortgage
$108,000
Interest Rate
9.49%
Purchase Details
Closed on
Mar 30, 1995
Sold by
Jeanmenne Renee M
Bought by
Jeanmenne Renee M and Haskins Dwane P
Home Financials for this Owner
Home Financials are based on the most recent Mortgage that was taken out on this home.
Original Mortgage
$78,583
Interest Rate
8.72%
Mortgage Type
FHA
Purchase Details
Closed on
Jul 24, 1991
Create a Home Valuation Report for This Property
The Home Valuation Report is an in-depth analysis detailing your home's value as well as a comparison with similar homes in the area
Home Values in the Area
Average Home Value in this Area
Purchase History
| Date | Buyer | Sale Price | Title Company |
|---|---|---|---|
| Calvillo Santos | $160,000 | -- | |
| Jeanmenne Renee M | -- | -- | |
| Jeanmenne Renee M | -- | -- | |
| Jeanmenne Renee M | $79,000 | -- | |
| -- | $62,600 | -- |
Source: Public Records
Mortgage History
| Date | Status | Borrower | Loan Amount |
|---|---|---|---|
| Open | Calvillo Santos | $157,528 | |
| Previous Owner | Jeanmenne Renee M | $108,000 | |
| Previous Owner | Jeanmenne Renee M | $78,583 |
Source: Public Records
Tax History
| Year | Tax Paid | Tax Assessment Tax Assessment Total Assessment is a certain percentage of the fair market value that is determined by local assessors to be the total taxable value of land and additions on the property. | Land | Improvement |
|---|---|---|---|---|
| 2025 | $2,589 | $26,990 | $5,640 | $21,350 |
| 2024 | $2,589 | $24,820 | $5,190 | $19,630 |
| 2023 | $2,630 | $28,410 | $5,210 | $23,200 |
| 2022 | $2,456 | $21,610 | $5,350 | $16,260 |
| 2021 | $2,559 | $21,610 | $5,350 | $16,260 |
| 2020 | $2,525 | $21,400 | $5,510 | $15,890 |
| 2019 | $2,521 | $21,400 | $5,510 | $15,890 |
| 2018 | $1,893 | $16,000 | $4,460 | $11,540 |
| 2017 | $1,682 | $16,000 | $4,460 | $11,540 |
| 2016 | $1,239 | $11,690 | $2,390 | $9,300 |
| 2015 | $1,200 | $11,690 | $2,390 | $9,300 |
| 2014 | $968 | $9,280 | $2,070 | $7,210 |
Source: Public Records
Map
Nearby Homes
- 19335 E Batavia Place
- 1619 Ensenada St
- 1914 Ensenada Ct
- 19562 E 19th Place
- 19682 E Batavia Dr
- 19044 E 16th Ave
- 1956 Cathay St
- 1791 Biscay St
- 19093 E 22nd Dr
- 20364 E Buchanan Dr
- 18944 E Carmel Dr
- 18820 E Carmel Cir
- 24165 E 30th Ave
- 24091 E 30th Ave
- 24121 E 30th Ave
- 24155 E 30th Ave
- 24101 E 30th Ave
- 17546 E Batavia Place
- 17585 E 18th Place Unit 105
- 1889 Salida St
- 19348 E Batavia Dr
- 19378 E Batavia Dr
- 19338 E Batavia Dr
- 19388 E Batavia Dr
- 19355 E Batavia Place
- 19375 E Batavia Place
- 19328 E Batavia Dr
- 19398 E Batavia Dr
- 19367 E Batavia Dr
- 19377 E Batavia Dr
- 19357 E Batavia Dr
- 19347 E Batavia Dr
- 19387 E Batavia Dr
- 19395 E Batavia Place
- 19318 E Batavia Dr
- 19325 E Batavia Place
- 19337 E Batavia Dr
- 19327 E Batavia Dr
- 19397 E Batavia Dr
- 19317 E Batavia Dr
Your Personal Tour Guide
Ask me questions while you tour the home.