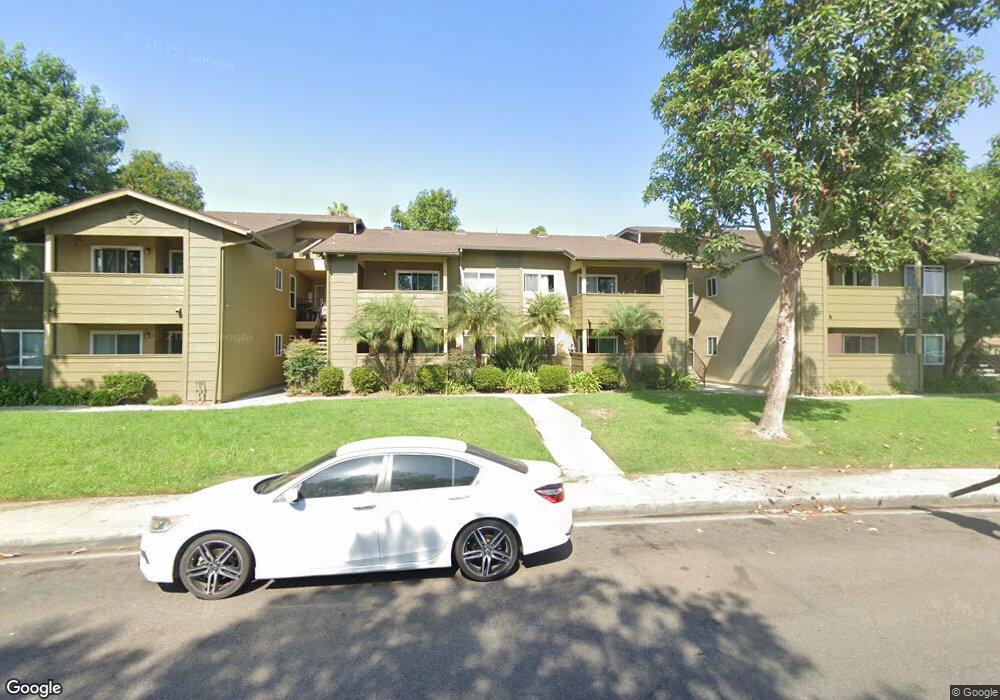
194 Avenida Descanso Unit J Oceanside, CA 92057
North Valley NeighborhoodEstimated Value: $444,000 - $453,000
2
Beds
2
Baths
912
Sq Ft
$492/Sq Ft
Est. Value
About This Home
This home is located at 194 Avenida Descanso Unit J, Oceanside, CA 92057 and is currently estimated at $448,423, approximately $491 per square foot. 194 Avenida Descanso Unit J is a home located in San Diego County with nearby schools including Reynolds Elementary School, Cesar Chavez Middle School, and El Camino High School.
Ownership History
Date
Name
Owned For
Owner Type
Purchase Details
Closed on
Jan 8, 2009
Sold by
Aurora Loan Services
Bought by
Grover Sandeep and Singh Gurindar
Current Estimated Value
Purchase Details
Closed on
May 29, 2008
Sold by
Mccloud Robert L
Bought by
Aurora Loan Services
Purchase Details
Closed on
Aug 4, 2005
Sold by
Mccloud Lanett R
Bought by
Mccloud Ii Robert L
Home Financials for this Owner
Home Financials are based on the most recent Mortgage that was taken out on this home.
Original Mortgage
$58,000
Interest Rate
5.56%
Mortgage Type
Stand Alone Second
Purchase Details
Closed on
Jun 20, 2005
Sold by
Avenida Coastal Llc
Bought by
Mccloud Ii Robert L
Home Financials for this Owner
Home Financials are based on the most recent Mortgage that was taken out on this home.
Original Mortgage
$58,000
Interest Rate
5.56%
Mortgage Type
Stand Alone Second
Create a Home Valuation Report for This Property
The Home Valuation Report is an in-depth analysis detailing your home's value as well as a comparison with similar homes in the area
Home Values in the Area
Average Home Value in this Area
Purchase History
| Date | Buyer | Sale Price | Title Company |
|---|---|---|---|
| Grover Sandeep | $100,000 | First American Title Company | |
| Aurora Loan Services | $172,500 | First American Title | |
| Mccloud Ii Robert L | -- | Chicago Title | |
| Mccloud Ii Robert L | $290,000 | Chicago Title Co |
Source: Public Records
Mortgage History
| Date | Status | Borrower | Loan Amount |
|---|---|---|---|
| Previous Owner | Mccloud Ii Robert L | $58,000 | |
| Previous Owner | Mccloud Ii Robert L | $232,000 |
Source: Public Records
Tax History Compared to Growth
Tax History
| Year | Tax Paid | Tax Assessment Tax Assessment Total Assessment is a certain percentage of the fair market value that is determined by local assessors to be the total taxable value of land and additions on the property. | Land | Improvement |
|---|---|---|---|---|
| 2025 | $1,456 | $128,758 | $64,379 | $64,379 |
| 2024 | $1,456 | $126,234 | $63,117 | $63,117 |
| 2023 | $1,412 | $123,760 | $61,880 | $61,880 |
| 2022 | $1,390 | $121,334 | $60,667 | $60,667 |
| 2021 | $1,396 | $118,956 | $59,478 | $59,478 |
| 2020 | $1,354 | $117,738 | $58,869 | $58,869 |
| 2019 | $1,315 | $115,430 | $57,715 | $57,715 |
| 2018 | $1,302 | $113,168 | $56,584 | $56,584 |
| 2017 | $1,278 | $110,950 | $55,475 | $55,475 |
| 2016 | $1,237 | $108,776 | $54,388 | $54,388 |
| 2015 | $1,202 | $107,144 | $53,572 | $53,572 |
| 2014 | $1,157 | $105,046 | $52,523 | $52,523 |
Source: Public Records
Map
Nearby Homes
- 194 Avenida Descanso Unit H
- 195 Avenida Descanso Unit 121
- 4616 N River Rd Unit 61
- 231 Riverview Way
- 4418 Jill St
- 213 Festival Dr
- 4660 N River Rd Unit 116
- 4660 N River Rd Unit 17
- 4660 N River Rd Unit 150
- 0 N River Rd Unit NDP2507519
- 4466 Saint Andrews Place
- 1 Calle Mariposa
- 4425 Arbor Cove Cir
- 4556 Mariners Bay
- 625 Sumner Way Unit 4
- 625 Sumner Way Unit 2
- 306 Trunks Bay
- 514 Calle Montecito Unit 78
- 638 Sumner Way Unit 2
- 517 Calle Montecito Unit 91
- 194 Avenida Descanso
- 194 Avenida Descanso Unit A
- 194 Avenida Descanso Unit 194 Avenida Descanso
- 194 Avenida Descanso
- 180 Avenida Descanso Unit I
- 190 Avenida Descanso
- 176 Avenida Descanso Unit E
- 156 Avenida Descanso
- 190 Avenida Descanso Unit J
- 180 Avenida Descanso Unit F
- 180 Avenida Descanso Unit I
- 180 Avenida Descanso Unit J
- 180 Avenida Descanso Unit A
- 180 Avenida Descanso Unit B
- 180 Avenida Descanso Unit E
- 156 Avenida Descanso Unit I
- 194 Avenida Descanso Unit L
- 194 Avenida Descanso Unit K
- 194 Avenida Descanso Unit I
- 194 Avenida Descanso Unit G