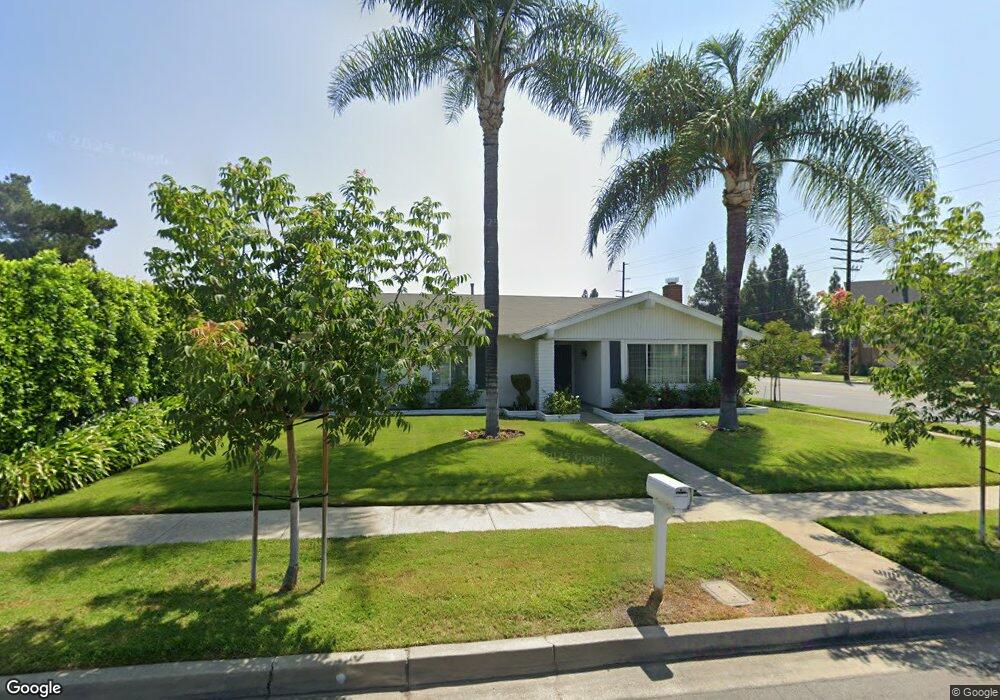
194 Fulton Way Upland, CA 91786
Estimated Value: $702,428 - $761,000
3
Beds
2
Baths
1,609
Sq Ft
$458/Sq Ft
Est. Value
About This Home
This home is located at 194 Fulton Way, Upland, CA 91786 and is currently estimated at $736,607, approximately $457 per square foot. 194 Fulton Way is a home located in San Bernardino County with nearby schools including Citrus Elementary, Upland Junior High School, and Upland High School.
Ownership History
Date
Name
Owned For
Owner Type
Purchase Details
Closed on
May 13, 2024
Sold by
Forni Adriana B
Bought by
Adriana Beatriz Rios De Forni Revocable Livin and De Forni
Current Estimated Value
Purchase Details
Closed on
Oct 18, 2012
Sold by
Forni Adriana
Bought by
Forni Adriana B
Home Financials for this Owner
Home Financials are based on the most recent Mortgage that was taken out on this home.
Original Mortgage
$243,714
Interest Rate
3.37%
Mortgage Type
FHA
Purchase Details
Closed on
Aug 25, 1997
Sold by
Federal Home Loan Mortgage Corporation
Bought by
Forni Adriana
Home Financials for this Owner
Home Financials are based on the most recent Mortgage that was taken out on this home.
Original Mortgage
$119,567
Interest Rate
4.95%
Purchase Details
Closed on
May 12, 1997
Sold by
Mca Mtg Corp
Bought by
Federal Home Loan Mortgage Corporation
Create a Home Valuation Report for This Property
The Home Valuation Report is an in-depth analysis detailing your home's value as well as a comparison with similar homes in the area
Home Values in the Area
Average Home Value in this Area
Purchase History
| Date | Buyer | Sale Price | Title Company |
|---|---|---|---|
| Adriana Beatriz Rios De Forni Revocable Livin | -- | None Listed On Document | |
| Forni Adriana B | -- | Western Resources Title | |
| Forni Adriana | $133,000 | Fidelity National Title | |
| Federal Home Loan Mortgage Corporation | -- | First Southwestern Title Co | |
| Mca Mtg Corp | $119,000 | First Southwestern Title Co |
Source: Public Records
Mortgage History
| Date | Status | Borrower | Loan Amount |
|---|---|---|---|
| Previous Owner | Forni Adriana B | $243,714 | |
| Previous Owner | Forni Adriana | $119,567 |
Source: Public Records
Tax History
| Year | Tax Paid | Tax Assessment Tax Assessment Total Assessment is a certain percentage of the fair market value that is determined by local assessors to be the total taxable value of land and additions on the property. | Land | Improvement |
|---|---|---|---|---|
| 2025 | $2,410 | $212,366 | $71,856 | $140,510 |
| 2024 | $2,333 | $208,202 | $70,447 | $137,755 |
| 2023 | $2,294 | $204,120 | $69,066 | $135,054 |
| 2022 | $2,243 | $200,118 | $67,712 | $132,406 |
| 2021 | $2,236 | $196,194 | $66,384 | $129,810 |
| 2020 | $2,175 | $194,182 | $65,703 | $128,479 |
| 2019 | $2,166 | $190,375 | $64,415 | $125,960 |
| 2018 | $2,115 | $186,642 | $63,152 | $123,490 |
| 2017 | $2,052 | $182,983 | $61,914 | $121,069 |
| 2016 | $1,868 | $179,395 | $60,700 | $118,695 |
| 2015 | $1,824 | $176,700 | $59,788 | $116,912 |
| 2014 | $1,776 | $173,239 | $58,617 | $114,622 |
Source: Public Records
Map
Nearby Homes
- 306 S Vallejo Way
- 134 Coral Way
- 885 W Arrow Hwy
- 428 W 8th St
- 595 Juniper Ave
- 126 Irving Way
- 633 Maple Way
- 435 W 9th St Unit B3
- 1443 Fredericks Ln
- 1550 N Bonita Ct
- 617 N Ukiah Way
- 1436 N Elderberry Ave
- 333 White Ave
- 345 Euclid Place
- 121 Genoa Way
- 1549 N Oaks Ct
- 0 Bay St Unit AR25093919
- 340 W Caroline Ct
- 1446 N Gardenia Ave
- 762 N Vallejo Way
- 182 Fulton Way
- 193 Sherman Way
- 181 Sherman Way
- 174 Fulton Way
- 171 Sherman Way
- 181 Fulton Way
- 160 Fulton Way
- 175 Fulton Way
- 159 Sherman Way
- 993 W 8th St
- 161 Fulton Way
- 194 Grayson Way
- 150 Fulton Way
- 182 Grayson Way
- 149 Sherman Way
- 994 Sheridan St
- 172 Grayson Way
- 204 Grayson Way Unit D
- 204 Grayson Way Unit Singh's Apartments
- 204 Grayson Way Unit C
Your Personal Tour Guide
Ask me questions while you tour the home.