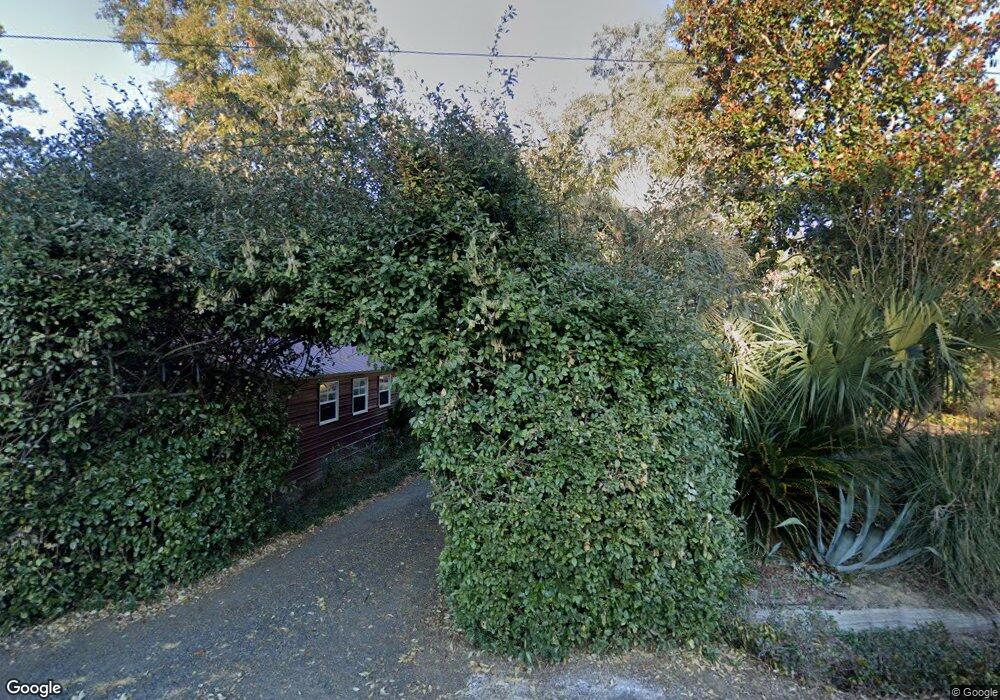
194 Jerico Dr Midway, GA 31320
Estimated Value: $272,815 - $319,000
3
Beds
3
Baths
1,934
Sq Ft
$151/Sq Ft
Est. Value
About This Home
This home is located at 194 Jerico Dr, Midway, GA 31320 and is currently estimated at $292,954, approximately $151 per square foot. 194 Jerico Dr is a home located in Liberty County with nearby schools including Liberty Elementary School, Midway Middle School, and Liberty County High School.
Ownership History
Date
Name
Owned For
Owner Type
Purchase Details
Closed on
Apr 24, 2019
Sold by
Curtas Coni Lynn
Bought by
Curtas Coni Lynn and Curtas Brett Alexander
Current Estimated Value
Home Financials for this Owner
Home Financials are based on the most recent Mortgage that was taken out on this home.
Original Mortgage
$104,150
Outstanding Balance
$89,829
Interest Rate
4%
Mortgage Type
New Conventional
Estimated Equity
$203,125
Purchase Details
Closed on
Nov 6, 2001
Sold by
Curtas Brett Alexand
Bought by
Curtas Coni Lynn
Purchase Details
Closed on
Apr 28, 2000
Sold by
Shull Natalie L S
Bought by
Curtas Brett Alexand
Purchase Details
Closed on
Dec 30, 1997
Sold by
Moore Paul
Bought by
Shull Natalie L S
Purchase Details
Closed on
Jun 25, 1993
Bought by
Moore Paul
Purchase Details
Closed on
Nov 10, 1992
Bought by
Moore Arnease
Create a Home Valuation Report for This Property
The Home Valuation Report is an in-depth analysis detailing your home's value as well as a comparison with similar homes in the area
Purchase History
| Date | Buyer | Sale Price | Title Company |
|---|---|---|---|
| Curtas Coni Lynn | -- | -- | |
| Curtas Coni Lynn | -- | -- | |
| Curtas Brett Alexand | $107,500 | -- | |
| Shull Natalie L S | $83,000 | -- | |
| Moore Paul | $80,000 | -- | |
| Moore Arnease | -- | -- |
Source: Public Records
Mortgage History
| Date | Status | Borrower | Loan Amount |
|---|---|---|---|
| Open | Curtas Coni Lynn | $104,150 |
Source: Public Records
Tax History
| Year | Tax Paid | Tax Assessment Tax Assessment Total Assessment is a certain percentage of the fair market value that is determined by local assessors to be the total taxable value of land and additions on the property. | Land | Improvement |
|---|---|---|---|---|
| 2024 | $3,214 | $91,970 | $22,164 | $69,806 |
| 2023 | $3,696 | $83,851 | $22,164 | $61,687 |
| 2022 | $2,660 | $69,584 | $22,164 | $47,420 |
| 2021 | $2,257 | $59,340 | $22,164 | $37,176 |
| 2020 | $2,276 | $59,858 | $22,164 | $37,694 |
| 2019 | $2,222 | $59,882 | $22,164 | $37,718 |
| 2018 | $2,218 | $60,449 | $22,164 | $38,285 |
| 2017 | $1,881 | $57,106 | $22,164 | $34,942 |
| 2016 | $1,978 | $57,626 | $22,164 | $35,463 |
| 2015 | $2,123 | $57,626 | $22,164 | $35,463 |
| 2014 | $2,123 | $61,222 | $24,179 | $37,043 |
| 2013 | -- | $58,050 | $24,178 | $33,871 |
Source: Public Records
Map
Nearby Homes
- 120 Jerico Dr
- 24 Jerico Marsh Lot 24 Rd
- 70 1st St
- 32 Woods Dr
- 91 W Ridge Ct
- 63 Wye Rd
- 1613 Lake Dr
- 690 Lake Dr
- 941 Lake Dr
- 967 Lake Dr
- 1370 Lake Dr
- 36 Tawny Ct
- lot 2 Oak Island Dr
- 138-140 Dogwood Ln
- 152-155 Dogwood Ln
- 116 Manchester Ct
- 42 Greenwood
- 28 Deer Trail Ln
- Lot 4 Palm Island Dr
- 0 Palm Island Dr Unit 160024
Your Personal Tour Guide
Ask me questions while you tour the home.