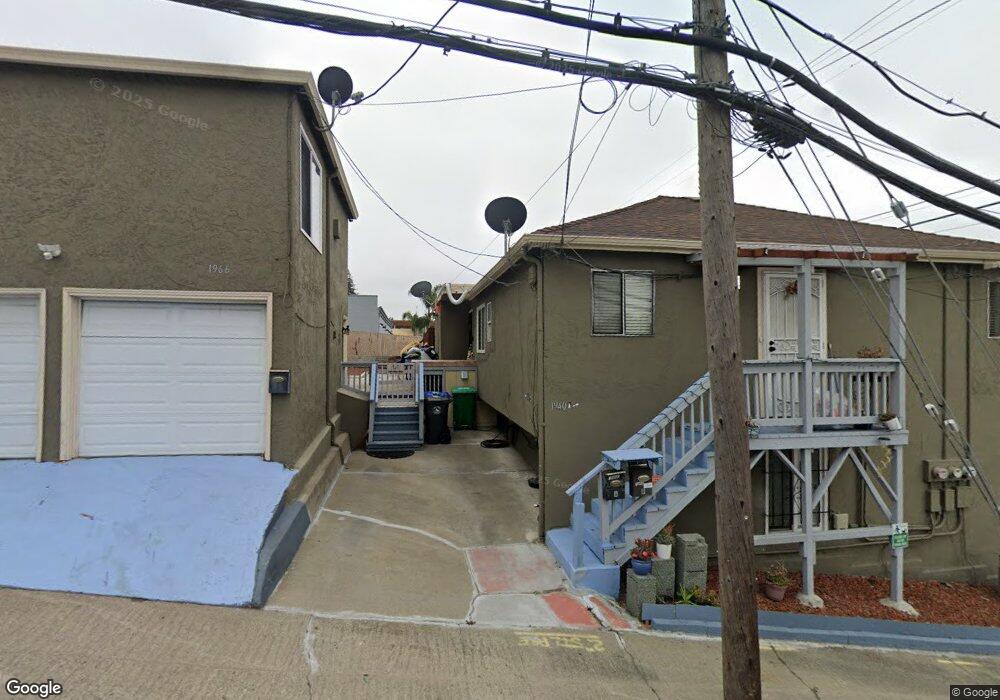
1940 170th Ave Castro Valley, CA 94546
West Castro Valley Neighborhood
4
Beds
4
Baths
2,341
Sq Ft
4,792
Sq Ft Lot
About This Home
This home is located at 1940 170th Ave, Castro Valley, CA 94546. 1940 170th Ave is a home located in Alameda County with nearby schools including Corvallis Elementary School, Edendale Middle, and San Lorenzo High School.
Ownership History
Date
Name
Owned For
Owner Type
Purchase Details
Closed on
Jul 8, 2013
Sold by
Chan Ling
Bought by
Sun Kai Chao and Xie Xue Na
Home Financials for this Owner
Home Financials are based on the most recent Mortgage that was taken out on this home.
Original Mortgage
$265,000
Outstanding Balance
$191,630
Interest Rate
3.79%
Mortgage Type
Commercial
Purchase Details
Closed on
Nov 2, 2011
Sold by
Fas Realty Inc
Bought by
Chan Ling
Purchase Details
Closed on
May 6, 2011
Sold by
Jaffray Douglas S and Vera Mary L
Bought by
Fas Realty Inc
Purchase Details
Closed on
Oct 28, 2005
Sold by
Roderigues Edwin and Roderigues Family Trust
Bought by
Jaffray Douglas S and Vera Mary L
Home Financials for this Owner
Home Financials are based on the most recent Mortgage that was taken out on this home.
Original Mortgage
$52,000
Interest Rate
5.74%
Mortgage Type
Credit Line Revolving
Purchase Details
Closed on
Jul 10, 1997
Sold by
Chibante Robert T and Chibante Guy A
Bought by
Chibante Annette A
Create a Home Valuation Report for This Property
The Home Valuation Report is an in-depth analysis detailing your home's value as well as a comparison with similar homes in the area
Home Values in the Area
Average Home Value in this Area
Purchase History
| Date | Buyer | Sale Price | Title Company |
|---|---|---|---|
| Sun Kai Chao | $408,000 | Old Republic Title Company | |
| Chan Ling | $299,000 | Chicago Title Company | |
| Chan Ling | -- | Chicago Title Company | |
| Fas Realty Inc | $183,000 | None Available | |
| Jaffray Douglas S | $520,000 | Chicago Title Company | |
| Chibante Annette A | -- | -- |
Source: Public Records
Mortgage History
| Date | Status | Borrower | Loan Amount |
|---|---|---|---|
| Open | Sun Kai Chao | $265,000 | |
| Previous Owner | Jaffray Douglas S | $52,000 | |
| Previous Owner | Jaffray Douglas S | $364,000 |
Source: Public Records
Tax History
| Year | Tax Paid | Tax Assessment Tax Assessment Total Assessment is a certain percentage of the fair market value that is determined by local assessors to be the total taxable value of land and additions on the property. | Land | Improvement |
|---|---|---|---|---|
| 2025 | $6,248 | $444,968 | $159,355 | $285,613 |
| 2024 | $6,248 | $436,245 | $156,231 | $280,014 |
| 2023 | $6,221 | $427,693 | $153,168 | $274,525 |
| 2022 | $6,121 | $419,307 | $150,165 | $269,142 |
| 2021 | $5,951 | $411,089 | $147,222 | $263,867 |
| 2020 | $5,824 | $406,875 | $145,713 | $261,162 |
| 2019 | $5,824 | $398,900 | $142,857 | $256,043 |
| 2018 | $5,500 | $391,080 | $140,056 | $251,024 |
| 2017 | $5,558 | $383,414 | $137,311 | $246,103 |
| 2016 | $5,171 | $375,896 | $134,618 | $241,278 |
| 2015 | $4,910 | $370,252 | $132,597 | $237,655 |
| 2014 | $4,838 | $363,000 | $130,000 | $233,000 |
Source: Public Records
Map
Nearby Homes
- 16860 Robey Dr
- 17028 Santa fe St
- 2135 173rd Ave
- 2082 167th Ave
- 16520 Los Banos St
- 20111 W Ridge Ct Unit 24
- 1560 165th Ave
- 2392 Austin Ct
- 16605 Rolando Ave
- 1510 165th Ave
- 16330 Ridgehaven Dr Unit 802
- 2500 Miramar Ave Unit 101
- 2500 Miramar Ave Unit 203
- 16311 Ria Dr
- 16306 Ridgehaven Dr Unit 104
- 21109 Gary Dr Unit 220
- 21109 Gary Dr Unit 303
- 21071 Gary Dr Unit 204
- 2843 Jennifer Dr
- 21117 Gary Dr Unit 119
- 17010 Foothill Blvd
- 1941 170th Ave Unit 1943
- 1986 170th Ave
- 17063 Ehle St
- 17065 Ehle St
- 17034 Foothill Blvd
- 1985 170th Ave
- 17109 Ehle St
- 16943 Ehle St
- 17131 Ehle St
- 17050 Foothill Blvd
- 16935 Ehle St
- 1947 170th Ave
- 16929 Ehle St
- 17050 Ehle St
- 17072 Ehle St
- 17108 Ehle St
- 16948 Ehle St
- 16919 Ehle St
- 17126 Ehle St
Your Personal Tour Guide
Ask me questions while you tour the home.