Estimated Value: $315,000 - $325,000
4
Beds
2
Baths
1,932
Sq Ft
$165/Sq Ft
Est. Value
About This Home
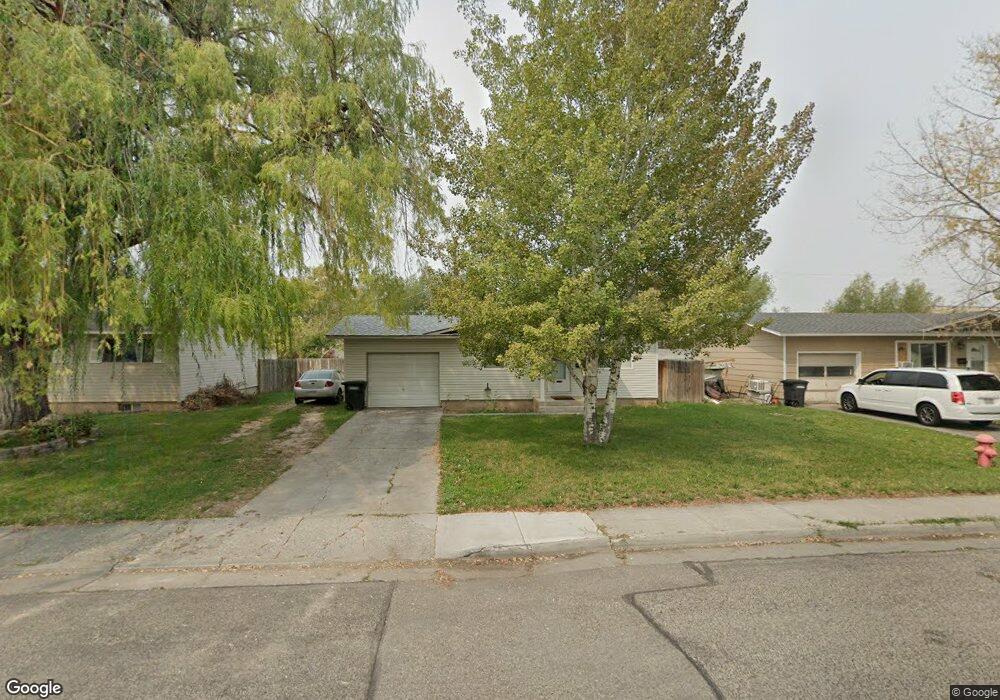
This home is located at 1940 Falcon Dr, Ammon, ID 83406 and is currently estimated at $319,103, approximately $165 per square foot. 1940 Falcon Dr is a home located in Bonneville County with nearby schools including Hillview Elementary School, Sandcreek Middle School, and Hillcrest High School.
Ownership History
Date
Name
Owned For
Owner Type
Purchase Details
Closed on
Dec 28, 2020
Sold by
Fuentes Bruce and Fuentes Theresa
Bought by
Harrison Alicia M and Harrison Trent A
Current Estimated Value
Home Financials for this Owner
Home Financials are based on the most recent Mortgage that was taken out on this home.
Original Mortgage
$4,500
Outstanding Balance
$2,588
Interest Rate
2.19%
Mortgage Type
New Conventional
Estimated Equity
$316,515
Purchase Details
Closed on
Mar 8, 2017
Sold by
Fuentes Theresa
Bought by
Fuentes Bruce
Home Financials for this Owner
Home Financials are based on the most recent Mortgage that was taken out on this home.
Original Mortgage
$127,153
Interest Rate
4.4%
Mortgage Type
FHA
Purchase Details
Closed on
Jun 23, 2009
Sold by
Stewart Brady E and Stewart Somer
Bought by
Willmore Cory K and Barnes Halley Jo
Home Financials for this Owner
Home Financials are based on the most recent Mortgage that was taken out on this home.
Original Mortgage
$120,726
Interest Rate
4.82%
Mortgage Type
FHA
Create a Home Valuation Report for This Property
The Home Valuation Report is an in-depth analysis detailing your home's value as well as a comparison with similar homes in the area
Purchase History
| Date | Buyer | Sale Price | Title Company |
|---|---|---|---|
| Harrison Alicia M | -- | Amerititle Idaho Falls | |
| Fuentes Bruce | -- | Alliance Title Idaho Falls O | |
| Fuentes Bruce | -- | Alliance Title Idaho Falls O | |
| Willmore Cory K | -- | -- |
Source: Public Records
Mortgage History
| Date | Status | Borrower | Loan Amount |
|---|---|---|---|
| Open | Harrison Alicia M | $4,500 | |
| Open | Harrison Alicia M | $174,600 | |
| Previous Owner | Fuentes Bruce | $127,153 | |
| Previous Owner | Willmore Cory K | $120,726 |
Source: Public Records
Tax History
| Year | Tax Paid | Tax Assessment Tax Assessment Total Assessment is a certain percentage of the fair market value that is determined by local assessors to be the total taxable value of land and additions on the property. | Land | Improvement |
|---|---|---|---|---|
| 2025 | $1,109 | $334,544 | $65,997 | $268,547 |
| 2024 | $1,032 | $320,896 | $55,308 | $265,588 |
| 2023 | $1,053 | $292,758 | $55,308 | $237,450 |
| 2022 | $1,032 | $240,778 | $39,448 | $201,330 |
| 2021 | $956 | $166,998 | $35,868 | $131,130 |
| 2019 | $986 | $146,385 | $31,185 | $115,200 |
| 2018 | $917 | $133,997 | $23,377 | $110,620 |
| 2017 | $866 | $120,952 | $17,002 | $103,950 |
| 2016 | $1,598 | $114,001 | $15,451 | $98,550 |
| 2015 | $1,529 | $108,611 | $15,451 | $93,160 |
| 2014 | $21,166 | $108,611 | $15,451 | $93,160 |
| 2013 | $798 | $108,620 | $15,450 | $93,170 |
Source: Public Records
Map
Nearby Homes
- TBD Eagle Dr Unit 9
- 1820 Falcon Dr
- 2710 E 17th St
- 1960 Bittern Dr
- Lot 7 Eagle Dr
- 2985 Eagle Dr
- 2850 Teton St
- 1504 Falcon Dr
- TBD E 25th Cir
- 2881 Sunburst Dr Unit 2881
- 2764 Derrald Ave
- 1146 S Curlew Dr
- 2305 Henryanna Ave
- 2401 Hoopes Ave
- 3280 Circle s Dr
- 3345 E Southwick
- 2049 Malibu Dr
- 1303 Jackson Dr
- 1025 E 12th St
- 1170 Jackson Dr
- 1940 S Falcon Dr
- 1930 Falcon Dr
- 1950 Falcon Dr
- 1935 Falcon Dr
- 1925 Falcon Dr
- 1910 Falcon Dr
- 1910 Falcon Dr
- 1960 Falcon Dr
- 1945 Falcon Dr
- 1915 Falcon Dr
- 1912 Bellagio Dr
- 1900 Falcon Dr
- 1980 Falcon Dr
- 1955 Falcon Dr
- 1900 Falcon Dr
- 1940 Eagle Dr
- 1920 Eagle Dr
- 1920 Eagle Dr Unit 1
- 1975 Falcon Dr
- 1905 Falcon Dr
Your Personal Tour Guide
Ask me questions while you tour the home.