Estimated Value: $581,000 - $683,000
3
Beds
2
Baths
1,733
Sq Ft
$366/Sq Ft
Est. Value
About This Home
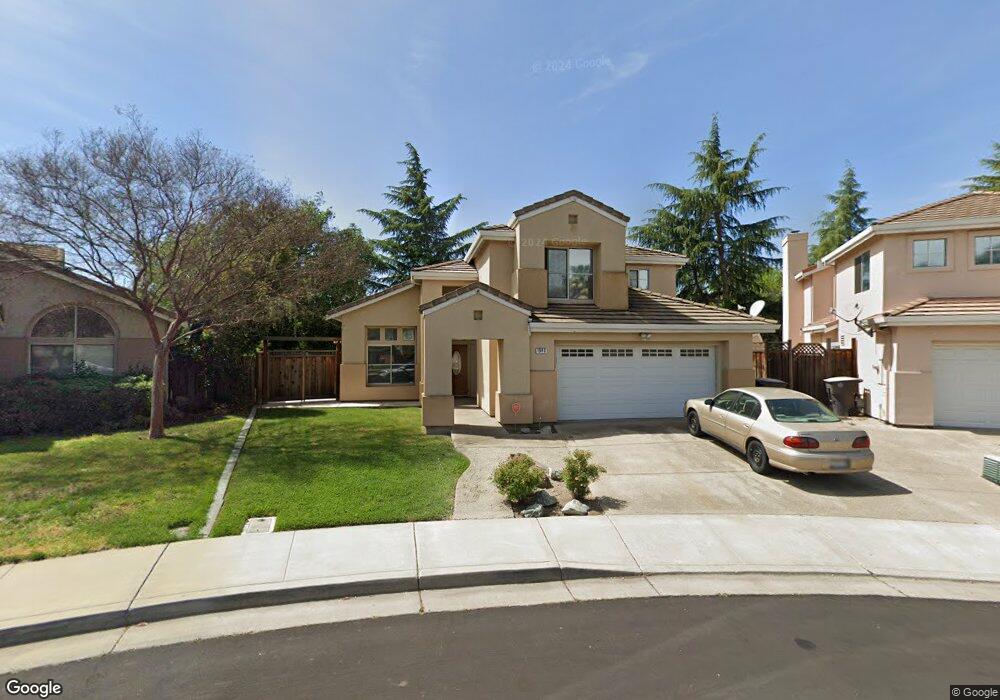
This home is located at 1940 Tahoe Cir, Tracy, CA 95376 and is currently estimated at $635,144, approximately $366 per square foot. 1940 Tahoe Cir is a home located in San Joaquin County with nearby schools including Wanda Hirsch Elementary School, Earle E. Williams Middle School, and John C. Kimball High School.
Ownership History
Date
Name
Owned For
Owner Type
Purchase Details
Closed on
Dec 22, 2010
Sold by
Paz Juan and Paz Lana L
Bought by
Cornelius Sharon
Current Estimated Value
Home Financials for this Owner
Home Financials are based on the most recent Mortgage that was taken out on this home.
Original Mortgage
$214,116
Outstanding Balance
$142,538
Interest Rate
4.37%
Mortgage Type
FHA
Estimated Equity
$492,606
Purchase Details
Closed on
Jul 25, 2002
Sold by
Paz Lana L and Thompson Lorenzo
Bought by
Paz Juan and Paz Lana L
Home Financials for this Owner
Home Financials are based on the most recent Mortgage that was taken out on this home.
Original Mortgage
$210,000
Interest Rate
7.8%
Purchase Details
Closed on
Jul 18, 1994
Sold by
Renown Enterprises Inc
Bought by
Thompson Lana L and Thompson Lorenzo
Home Financials for this Owner
Home Financials are based on the most recent Mortgage that was taken out on this home.
Original Mortgage
$155,113
Interest Rate
8.25%
Mortgage Type
FHA
Create a Home Valuation Report for This Property
The Home Valuation Report is an in-depth analysis detailing your home's value as well as a comparison with similar homes in the area
Home Values in the Area
Average Home Value in this Area
Purchase History
We collect this data history from publicly available records. To have your information removed, we recommend requesting removal directly through your county’s website.
| Date | Buyer | Sale Price | Title Company |
|---|---|---|---|
| Cornelius Sharon | $217,000 | Old Republic Title Company | |
| Paz Juan | -- | Chicago Title Co | |
| Thompson Lana L | $179,000 | Old Republic Title Company |
Source: Public Records
Mortgage History
We collect this data history from publicly available records. To have your information removed, we recommend requesting removal directly through your county’s website.
| Date | Status | Borrower | Loan Amount |
|---|---|---|---|
| Open | Cornelius Sharon | $214,116 | |
| Previous Owner | Paz Juan | $210,000 | |
| Previous Owner | Thompson Lana L | $155,113 |
Source: Public Records
Tax History
| Year | Tax Paid | Tax Assessment Tax Assessment Total Assessment is a certain percentage of the fair market value that is determined by local assessors to be the total taxable value of land and additions on the property. | Land | Improvement |
|---|---|---|---|---|
| 2025 | $3,314 | $278,004 | $69,179 | $208,825 |
| 2024 | $3,061 | $272,554 | $67,823 | $204,731 |
| 2023 | $3,010 | $267,211 | $66,494 | $200,717 |
| 2022 | $2,946 | $261,973 | $65,191 | $196,782 |
| 2021 | $2,907 | $256,837 | $63,913 | $192,924 |
| 2020 | $2,886 | $254,204 | $63,258 | $190,946 |
| 2019 | $2,837 | $249,220 | $62,018 | $187,202 |
| 2018 | $3,028 | $244,334 | $60,802 | $183,532 |
| 2017 | $2,891 | $239,544 | $59,610 | $179,934 |
| 2016 | $2,911 | $234,849 | $58,442 | $176,407 |
| 2014 | $2,751 | $226,791 | $56,436 | $170,355 |
Source: Public Records
Map
Nearby Homes
- 1930 Tahoe Cir
- 1445 Yorkshire Loop
- 1826 Pelican Ct
- 2053 Raven St
- 1331 Claremont Dr
- 1121 Andreas Ln
- 1703 Egret Dr
- 1670 Tahoe Cir
- 2040 Iberis Ct
- 1110 Plymouth Dr
- 1091 Plymouth Dr
- 11378 Mountain View Rd
- 1061 Plymouth Dr
- 635 Menay Dr
- 784 Bogetti Ln
- 1582 Ivy Ln
- 1007 Lourence Dr
- 1745 Parkside Dr
- 1170 Cornucopia Place
- 540 Morris Phelps Dr
- 1950 Tahoe Cir
- 1960 Tahoe Cir
- 1920 Tahoe Cir
- 991 Allegheny St
- 971 Allegheny St
- 1970 Tahoe Cir
- 1910 Tahoe Cir
- 951 Allegheny St
- 1955 Tahoe Cir
- 1204 Newcastle Ct
- 1925 Tahoe Cir
- 1980 Tahoe Cir
- 1900 Tahoe Cir
- 1235 Eagle St
- 1985 Tahoe Cir
- 931 Allegheny St
- 1905 Tahoe Cir
- 1224 Newcastle Ct
- 1990 Tahoe Cir
- 1821 Columbia Ct
Your Personal Tour Guide
Ask me questions while you tour the home.