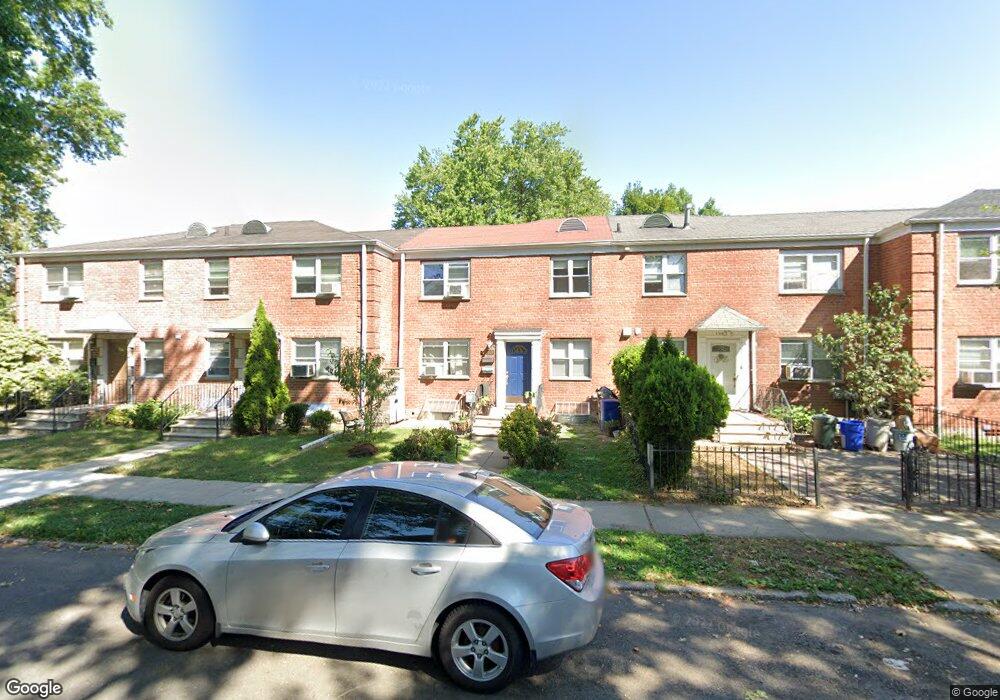
19409 39th Ave Flushing, NY 11358
Auburndale NeighborhoodEstimated Value: $1,055,000 - $1,140,000
Studio
--
Bath
1,650
Sq Ft
$674/Sq Ft
Est. Value
About This Home
This home is located at 19409 39th Ave, Flushing, NY 11358 and is currently estimated at $1,112,639, approximately $674 per square foot. 19409 39th Ave is a home located in Queens County with nearby schools including P.S. 32 - State Street, I.S. 25 Adrien Block, and Francis Lewis High School.
Ownership History
Date
Name
Owned For
Owner Type
Purchase Details
Closed on
Jun 3, 2010
Sold by
Kambitsis Tina and Polihronakis Tina
Bought by
Cheng Aya Mizuguchi and Cheng Ethan
Current Estimated Value
Home Financials for this Owner
Home Financials are based on the most recent Mortgage that was taken out on this home.
Original Mortgage
$300,000
Outstanding Balance
$201,652
Interest Rate
5.03%
Mortgage Type
Purchase Money Mortgage
Estimated Equity
$910,987
Purchase Details
Closed on
Oct 27, 1998
Sold by
Peters Sophy
Bought by
Kambitsis Tina
Home Financials for this Owner
Home Financials are based on the most recent Mortgage that was taken out on this home.
Original Mortgage
$200,000
Interest Rate
6.7%
Purchase Details
Closed on
Dec 2, 1996
Sold by
Peters Paul
Bought by
Peters Sophy
Create a Home Valuation Report for This Property
The Home Valuation Report is an in-depth analysis detailing your home's value as well as a comparison with similar homes in the area
Home Values in the Area
Average Home Value in this Area
Purchase History
| Date | Buyer | Sale Price | Title Company |
|---|---|---|---|
| Cheng Aya Mizuguchi | $625,000 | -- | |
| Kambitsis Tina | $276,000 | First American Title Ins Co | |
| Peters Sophy | $180,000 | Security Title & Guaranty Co |
Source: Public Records
Mortgage History
| Date | Status | Borrower | Loan Amount |
|---|---|---|---|
| Open | Cheng Aya Mizuguchi | $300,000 | |
| Previous Owner | Kambitsis Tina | $200,000 |
Source: Public Records
Tax History
| Year | Tax Paid | Tax Assessment Tax Assessment Total Assessment is a certain percentage of the fair market value that is determined by local assessors to be the total taxable value of land and additions on the property. | Land | Improvement |
|---|---|---|---|---|
| 2025 | $9,034 | $46,381 | $10,563 | $35,818 |
| 2024 | $9,046 | $46,380 | $12,454 | $33,926 |
| 2023 | $8,515 | $43,793 | $11,151 | $32,642 |
| 2022 | $8,382 | $59,880 | $15,660 | $44,220 |
| 2021 | $8,326 | $52,260 | $15,660 | $36,600 |
| 2020 | $7,885 | $55,320 | $15,660 | $39,660 |
| 2019 | $7,792 | $57,600 | $15,660 | $41,940 |
| 2018 | $7,142 | $36,494 | $10,490 | $26,004 |
| 2017 | $7,077 | $36,188 | $12,032 | $24,156 |
| 2016 | $6,515 | $36,188 | $12,032 | $24,156 |
| 2015 | $4,118 | $32,209 | $13,736 | $18,473 |
| 2014 | $4,118 | $32,209 | $15,237 | $16,972 |
Source: Public Records
Map
Nearby Homes
- 3617 194th St
- 36-20 194th St Unit 3r
- 194-23 Station Rd
- 195-31 39th Ave
- 191-9 39th Ave Unit 164
- 192-14 Station Rd
- 37-02 Francis Lewis Blvd
- 37-6 Francis Lewis Blvd
- 37-08 Francis Lewis Blvd
- 191-02 39th Ave
- 19112 Station Rd
- 191-08 Station Rd
- 4032 195th St
- 4038 194th St Unit 3B
- 40-38 194th St Unit A-1
- 190-05 39th Ave Unit 140
- 190-05 39th Ave Unit 142
- 36- 40 201st St Unit A, B, C
- 4048 194th St Unit A3
- 36-20 190th St
- 19411 39th Ave
- 19403 39th Ave
- 3707 194th St
- 3707 194th St
- 19415 39th Ave
- 3708 195th St
- 19408 37th Ave
- 19410 37th Ave
- 194-10 37th Ave Unit 1FL
- 194-10 37th Ave
- 194-08 37th Ave Unit 2
- 194-08 37th Ave
- 194-12 37th Ave Unit 1
- 194-12 37th Ave
- 194-06 39th Ave Unit 1
- 19402 39th Ave
- 19402 37th Ave
- 194-14 39th Ave Unit B
- 194-12 39th Ave Unit Lower
- 194-18 37th Ave Unit 1Fl
Your Personal Tour Guide
Ask me questions while you tour the home.