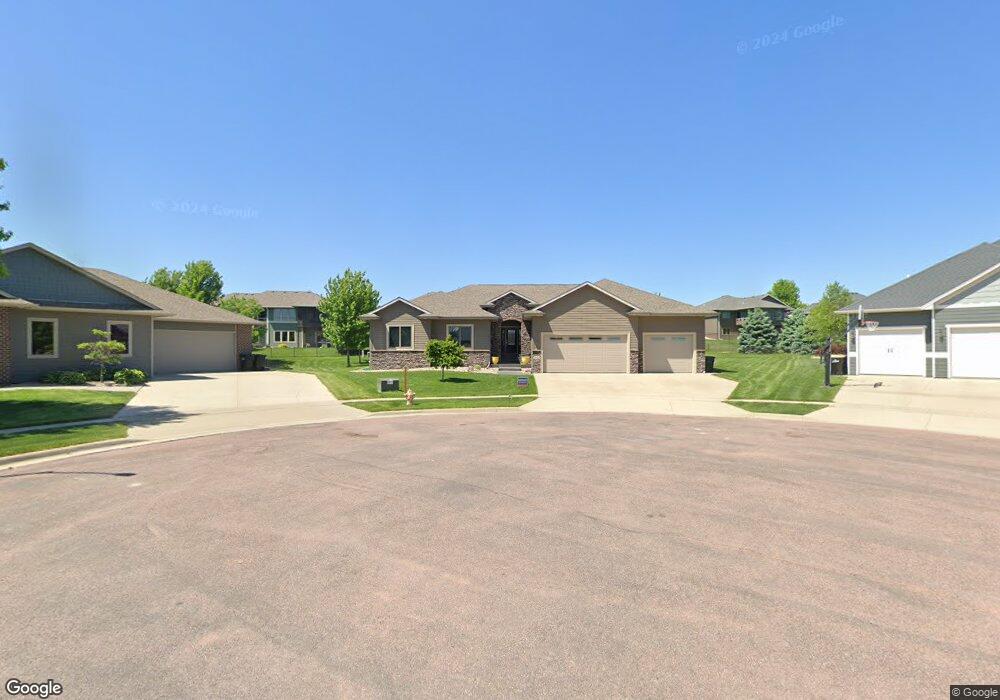
1941 Rainy Cir Sioux Falls, SD 57110
Copper Creek NeighborhoodEstimated Value: $565,000 - $903,000
3
Beds
4
Baths
2,247
Sq Ft
$298/Sq Ft
Est. Value
About This Home
This home is located at 1941 Rainy Cir, Sioux Falls, SD 57110 and is currently estimated at $669,246, approximately $297 per square foot. 1941 Rainy Cir is a home with nearby schools including Brandon Valley Intermediate School, Brandon Valley Middle School, and Brandon Valley High School.
Ownership History
Date
Name
Owned For
Owner Type
Purchase Details
Closed on
Sep 23, 2020
Sold by
Vansloten Jason M and Vansloten Van Sloten
Bought by
Vansloten Jamie N
Current Estimated Value
Home Financials for this Owner
Home Financials are based on the most recent Mortgage that was taken out on this home.
Original Mortgage
$328,000
Outstanding Balance
$291,078
Interest Rate
2.9%
Mortgage Type
New Conventional
Estimated Equity
$378,168
Purchase Details
Closed on
Oct 25, 2013
Sold by
Wolthuizen Jason
Bought by
Vansloten Jason M and Van Sloten Jamie N
Purchase Details
Closed on
Jun 10, 2013
Sold by
Savanna Development Llp
Bought by
Wolthuizen Jason and Midwest Premier Homes
Home Financials for this Owner
Home Financials are based on the most recent Mortgage that was taken out on this home.
Original Mortgage
$282,708
Interest Rate
3.43%
Mortgage Type
Construction
Create a Home Valuation Report for This Property
The Home Valuation Report is an in-depth analysis detailing your home's value as well as a comparison with similar homes in the area
Home Values in the Area
Average Home Value in this Area
Purchase History
| Date | Buyer | Sale Price | Title Company |
|---|---|---|---|
| Vansloten Jamie N | -- | Stewart Title Company | |
| Vansloten Jason M | $420,000 | -- | |
| Wolthuizen Jason | $62,000 | -- |
Source: Public Records
Mortgage History
| Date | Status | Borrower | Loan Amount |
|---|---|---|---|
| Open | Vansloten Jamie N | $328,000 | |
| Previous Owner | Wolthuizen Jason | $282,708 |
Source: Public Records
Tax History
| Year | Tax Paid | Tax Assessment Tax Assessment Total Assessment is a certain percentage of the fair market value that is determined by local assessors to be the total taxable value of land and additions on the property. | Land | Improvement |
|---|---|---|---|---|
| 2024 | $8,346 | $634,900 | $113,200 | $521,700 |
| 2023 | $8,517 | $601,500 | $107,300 | $494,200 |
| 2022 | $7,923 | $529,500 | $107,300 | $422,200 |
| 2021 | $7,609 | $507,200 | $0 | $0 |
| 2020 | $7,609 | $472,100 | $0 | $0 |
| 2019 | $7,750 | $472,681 | $0 | $0 |
| 2018 | $7,253 | $439,929 | $0 | $0 |
| 2017 | $7,266 | $436,625 | $63,273 | $373,352 |
| 2016 | $7,266 | $430,017 | $63,273 | $366,744 |
| 2015 | $7,289 | $410,362 | $63,273 | $347,089 |
| 2014 | -- | $408,465 | $61,905 | $346,560 |
Source: Public Records
Map
Nearby Homes
- 7100 E Archstone St
- 1917 S Firefly Dr
- 1909 S Firefly Dr
- 1920 S Firefly Dr
- 6813 E Limestone Cir
- 2108 S Silverpine Ct Ct
- 2105 S Silverpine Ct
- 6801 E Archstone St
- 2002 S Meadowview Cir
- 1601 S Sierra Cir
- 1805 S Copper Crest Cir
- 2300 S Meadowview Ave
- 2300 S Galena Ct
- 7308 E Gray Eagle Cir
- 7317 E Gray Eagle Cir
- 2029 S Abbeystone Ct
- 2601 S Galena Ave
- 7312 E Agate Cir
- 2605 S Galena Ave
- 6500 E Steamboat Trail
- 1944 Rainy Cir
- 1935 Rainy Cir
- 2100 Canyon Ave
- 2100 S Canyon Ave
- 2012 Canyon Ave
- 2012 S Canyon Ave
- 2104 Canyon Ave
- 2004 S Firefly Dr
- 1940 Rainy Cir
- 2008 Canyon Ave
- 2008 S Canyon Ave
- 2108 S Canyon Ave
- 2108 Canyon Ave
- 1930 Rainy Cir
- 2008 S Firefly Dr
- 2005 S Firefly Dr
- 2004 Canyon Ave
- 2004 S Canyon Ave
- 2001 S Firefly Dr
- 2201 S Firestone Ln
Your Personal Tour Guide
Ask me questions while you tour the home.