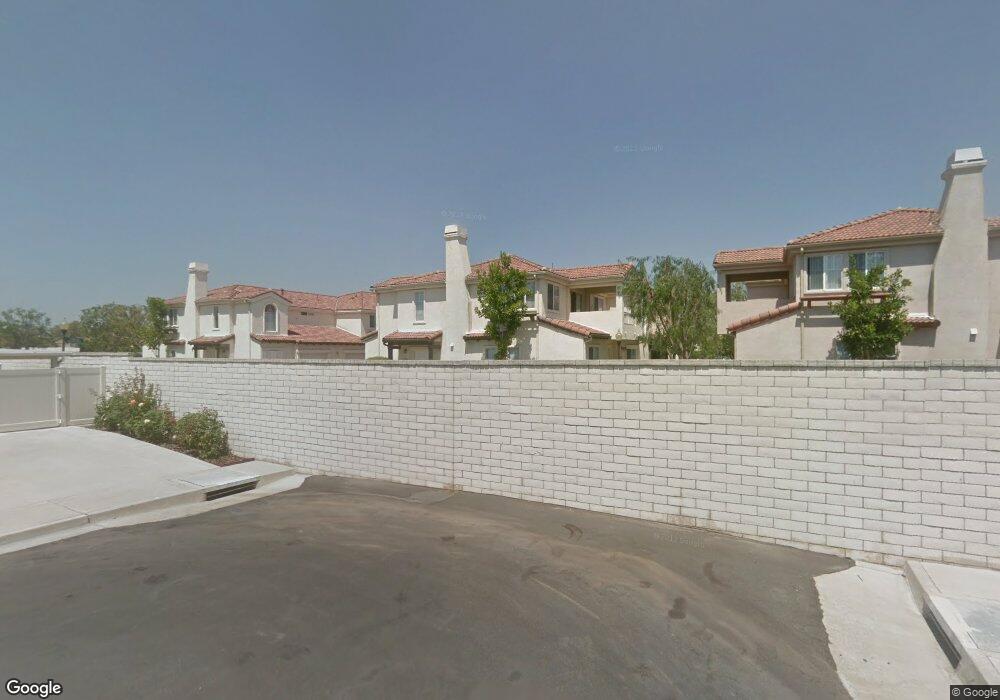
19419 Ruby Ct Unit C Cerritos, CA 90703
Estimated Value: $219,000 - $231,000
2
Beds
1
Bath
891
Sq Ft
$253/Sq Ft
Est. Value
About This Home
This home is located at 19419 Ruby Ct Unit C, Cerritos, CA 90703 and is currently estimated at $225,459, approximately $253 per square foot. 19419 Ruby Ct Unit C is a home located in Los Angeles County with nearby schools including Carver Elementary School, Tetzlaff (Martin B.) Middle School, and Cerritos High School.
Ownership History
Date
Name
Owned For
Owner Type
Purchase Details
Closed on
Jul 2, 2020
Sold by
Patel Chiman
Bought by
Patel Chiman and Patel Lila C
Current Estimated Value
Purchase Details
Closed on
Oct 23, 2018
Sold by
Patel Lila C
Bought by
Patel Chiman
Purchase Details
Closed on
Jun 5, 2018
Sold by
Westmoreland Sandra J
Bought by
Westmoreland James L and Westmoreland Snadra J
Purchase Details
Closed on
Oct 23, 2017
Sold by
Westmoreland James L and Westmoreland Sandra J
Bought by
Patel Chinman
Purchase Details
Closed on
Oct 22, 2001
Sold by
Mortinson Arlene and Westmoreland James
Bought by
Mortinson Arlene and Westmoreland Sandra J
Purchase Details
Closed on
Dec 13, 1999
Sold by
Cerritos Development Llc
Bought by
Mortinson Arlene
Create a Home Valuation Report for This Property
The Home Valuation Report is an in-depth analysis detailing your home's value as well as a comparison with similar homes in the area
Home Values in the Area
Average Home Value in this Area
Purchase History
| Date | Buyer | Sale Price | Title Company |
|---|---|---|---|
| Patel Chiman | -- | None Available | |
| Patel Chiman | -- | Wfg National Title Company | |
| Westmoreland James L | -- | None Available | |
| Patel Chinman | $160,000 | Wfg National Title Company | |
| Mortinson Arlene | -- | -- | |
| Mortinson Arlene | $128,000 | Lawyers Title Company |
Source: Public Records
Tax History
| Year | Tax Paid | Tax Assessment Tax Assessment Total Assessment is a certain percentage of the fair market value that is determined by local assessors to be the total taxable value of land and additions on the property. | Land | Improvement |
|---|---|---|---|---|
| 2025 | $2,258 | $178,444 | $78,084 | $100,360 |
| 2024 | $2,258 | $174,946 | $76,553 | $98,393 |
| 2023 | $2,187 | $171,516 | $75,052 | $96,464 |
| 2022 | $2,150 | $168,154 | $73,581 | $94,573 |
| 2021 | $2,097 | $164,858 | $72,139 | $92,719 |
| 2020 | $2,079 | $163,169 | $71,400 | $91,769 |
| 2019 | $2,047 | $159,970 | $70,000 | $89,970 |
| 2018 | $1,334 | $103,387 | $41,350 | $62,037 |
| 2017 | $1,304 | $101,361 | $40,540 | $60,821 |
| 2016 | $1,268 | $99,375 | $39,746 | $59,629 |
| 2015 | $1,252 | $97,883 | $39,149 | $58,734 |
| 2014 | $1,235 | $95,967 | $38,383 | $57,584 |
Source: Public Records
Map
Nearby Homes
- 4922 El Rancho Verde Dr
- 4841 Sharon Dr
- 13026 San Salvador Place
- 7662 Cory Cir
- 5091 Sharon Dr
- 7722 Laurelwood Ln
- 18727 Holmes Ave
- 8032 Lancashire Cir
- 12711 Castleford Ln
- 4932 Windsong Ave
- 5562 Thelma Ave
- 18622 Kamstra Ave
- 7371 Spruce Cir
- 5201 Del Serra Cir
- 8326 Fontainbleau Way
- 8342 Fontainbleau Way
- 7891 Comstock Cir
- 4282 Crystal Cir
- 19705 Teresa Ct
- 5826 Bolivia Dr
- 19419 Ruby Ct
- 19419 Ruby Ct Unit D
- 19419 Ruby Ct Unit I
- 19419 Ruby Ct Unit K
- 19419 Ruby Ct Unit L
- 19419 Ruby Ct Unit N
- 19419 Ruby Ct Unit H
- 19419 Ruby Ct Unit J
- 19419 Ruby Ct Unit M
- 19419 Ruby Ct Unit F
- 19419 Ruby Ct Unit A
- 19419 Ruby Ct Unit G
- 19419 Ruby Ct Unit E
- 19419 Ruby Ct Unit B
- 7501 Trabuco Ln
- 19423 Sapphire Ct Unit E
- 19423 Sapphire Ct Unit B
- 19423 Sapphire Ct Unit K
- 19423 Sapphire Ct Unit N
- 19423 Sapphire Ct Unit J
Your Personal Tour Guide
Ask me questions while you tour the home.