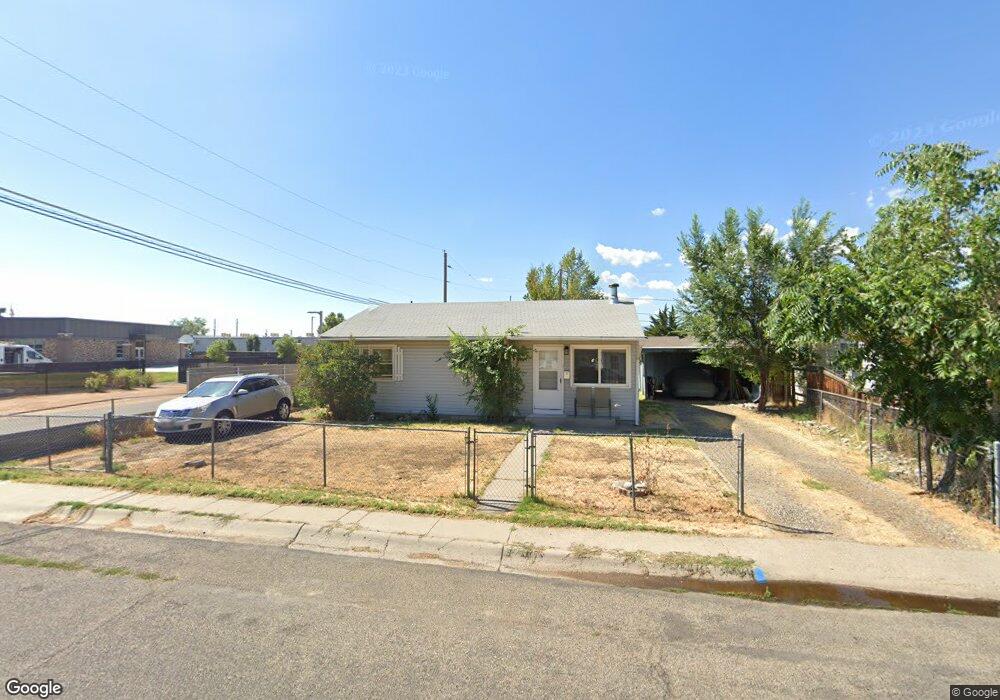
1943 Ouray Ave Grand Junction, CO 81501
Downtown Grand Junction NeighborhoodEstimated Value: $269,769 - $316,000
2
Beds
1
Bath
884
Sq Ft
$325/Sq Ft
Est. Value
About This Home
This home is located at 1943 Ouray Ave, Grand Junction, CO 81501 and is currently estimated at $287,442, approximately $325 per square foot. 1943 Ouray Ave is a home located in Mesa County with nearby schools including Chipeta Elementary School, East Middle School, and Bookcliff Middle School.
Ownership History
Date
Name
Owned For
Owner Type
Purchase Details
Closed on
Oct 17, 2014
Sold by
Mestas Lonnie C and Mestas Mary J
Bought by
Mestas Lonnie C
Current Estimated Value
Home Financials for this Owner
Home Financials are based on the most recent Mortgage that was taken out on this home.
Original Mortgage
$137,698
Outstanding Balance
$105,798
Interest Rate
4.16%
Mortgage Type
VA
Estimated Equity
$181,644
Purchase Details
Closed on
Nov 19, 2009
Sold by
Graham Cynthia L
Bought by
Mestas Lonnie C and Mestas Mary J
Home Financials for this Owner
Home Financials are based on the most recent Mortgage that was taken out on this home.
Original Mortgage
$144,337
Interest Rate
4.83%
Mortgage Type
FHA
Purchase Details
Closed on
Jun 21, 1983
Sold by
Winters Rosie Mae
Bought by
Maestas Lonnie C
Purchase Details
Closed on
Jan 11, 1952
Sold by
Vanderen Coe
Bought by
Maestas Lonnie C
Create a Home Valuation Report for This Property
The Home Valuation Report is an in-depth analysis detailing your home's value as well as a comparison with similar homes in the area
Home Values in the Area
Average Home Value in this Area
Purchase History
| Date | Buyer | Sale Price | Title Company |
|---|---|---|---|
| Mestas Lonnie C | -- | Title Source Inc | |
| Mestas Lonnie C | $147,000 | Abstract & Title Company Of | |
| Maestas Lonnie C | $50,000 | -- | |
| Maestas Lonnie C | -- | -- |
Source: Public Records
Mortgage History
| Date | Status | Borrower | Loan Amount |
|---|---|---|---|
| Open | Mestas Lonnie C | $137,698 | |
| Closed | Mestas Lonnie C | $144,337 |
Source: Public Records
Tax History Compared to Growth
Tax History
| Year | Tax Paid | Tax Assessment Tax Assessment Total Assessment is a certain percentage of the fair market value that is determined by local assessors to be the total taxable value of land and additions on the property. | Land | Improvement |
|---|---|---|---|---|
| 2024 | $440 | $12,440 | $4,390 | $8,050 |
| 2023 | $440 | $12,440 | $4,390 | $8,050 |
| 2022 | $427 | $11,850 | $3,480 | $8,370 |
| 2021 | $429 | $12,200 | $3,580 | $8,620 |
| 2020 | $358 | $10,420 | $3,580 | $6,840 |
| 2019 | $677 | $10,420 | $3,580 | $6,840 |
| 2018 | $739 | $10,450 | $3,240 | $7,210 |
| 2017 | $573 | $10,450 | $3,240 | $7,210 |
| 2016 | $573 | $9,130 | $3,380 | $5,750 |
| 2015 | $580 | $9,130 | $3,380 | $5,750 |
| 2014 | $538 | $8,540 | $2,790 | $5,750 |
Source: Public Records
Map
Nearby Homes
- 1931 Ouray Ave
- 1944 Parkland Ct
- 1942 Ouray Ave
- 1938 Ouray Ave
- 1960 Ouray Ave
- 1934 Parkland Ct
- 1954 Parkland Ct
- 1917 Ouray Ave
- 1926 Ouray Ave
- 513 N 20th St
- 1924 Parkland Ct
- 1914 Ouray Ave
- 1903 Ouray Ave
- 1945 Parkland Ct
- 523 N 20th St
- 2020 Ouray Ave
- 1914 Parkland Ct
- 1902 Ouray Ave
- 1935 Parkland Ct
- 1921 Chipeta Ct