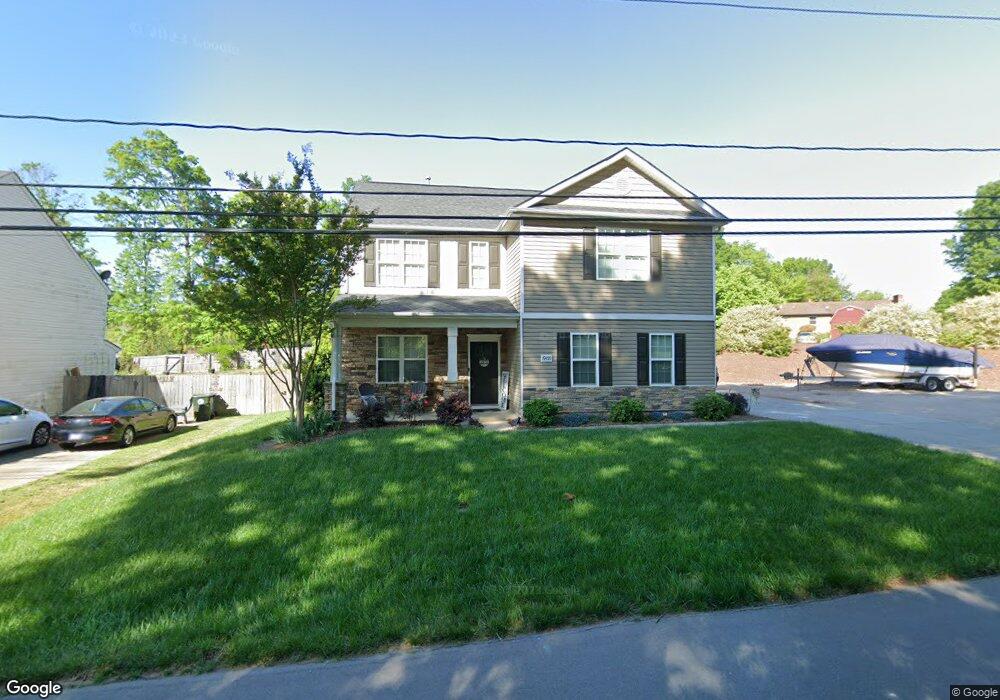
19455 Smith Cir Unit 1 Cornelius, NC 28031
Estimated Value: $518,000 - $542,055
4
Beds
3
Baths
2,219
Sq Ft
$239/Sq Ft
Est. Value
About This Home
This home is located at 19455 Smith Cir Unit 1, Cornelius, NC 28031 and is currently estimated at $530,514, approximately $239 per square foot. 19455 Smith Cir Unit 1 is a home located in Mecklenburg County with nearby schools including Cornelius Elementary School, Bailey Middle School, and William Amos Hough High School.
Ownership History
Date
Name
Owned For
Owner Type
Purchase Details
Closed on
Aug 19, 2025
Sold by
Barnes Trent and Barnes Julie
Bought by
Nieman James and Nieman Marianna
Current Estimated Value
Home Financials for this Owner
Home Financials are based on the most recent Mortgage that was taken out on this home.
Original Mortgage
$424,000
Outstanding Balance
$423,633
Interest Rate
6.72%
Mortgage Type
New Conventional
Estimated Equity
$106,881
Purchase Details
Closed on
Sep 25, 2014
Sold by
Oakmont Home Builders Inc
Bought by
Barnes Trent and Barnes Julie
Home Financials for this Owner
Home Financials are based on the most recent Mortgage that was taken out on this home.
Original Mortgage
$198,942
Interest Rate
4.17%
Mortgage Type
New Conventional
Purchase Details
Closed on
Apr 21, 2014
Sold by
Stringfellow Judson and Stringfellow Donna
Bought by
Oakmont Home Builders Inc
Create a Home Valuation Report for This Property
The Home Valuation Report is an in-depth analysis detailing your home's value as well as a comparison with similar homes in the area
Home Values in the Area
Average Home Value in this Area
Purchase History
| Date | Buyer | Sale Price | Title Company |
|---|---|---|---|
| Nieman James | $530,000 | None Listed On Document | |
| Nieman James | $530,000 | None Listed On Document | |
| Barnes Trent | $209,500 | None Available | |
| Oakmont Home Builders Inc | $120,000 | None Available |
Source: Public Records
Mortgage History
| Date | Status | Borrower | Loan Amount |
|---|---|---|---|
| Open | Nieman James | $424,000 | |
| Closed | Nieman James | $424,000 | |
| Previous Owner | Barnes Trent | $198,942 | |
| Closed | Oakmont Home Builders Inc | $0 |
Source: Public Records
Tax History
| Year | Tax Paid | Tax Assessment Tax Assessment Total Assessment is a certain percentage of the fair market value that is determined by local assessors to be the total taxable value of land and additions on the property. | Land | Improvement |
|---|---|---|---|---|
| 2025 | $3,116 | $467,300 | $116,000 | $351,300 |
| 2024 | $3,116 | $467,300 | $116,000 | $351,300 |
| 2023 | $3,116 | $467,300 | $116,000 | $351,300 |
| 2022 | $2,382 | $275,900 | $63,000 | $212,900 |
| 2021 | $2,354 | $275,900 | $63,000 | $212,900 |
| 2020 | $2,354 | $275,900 | $63,000 | $212,900 |
| 2019 | $2,348 | $275,900 | $63,000 | $212,900 |
| 2018 | $2,150 | $196,900 | $38,000 | $158,900 |
| 2017 | $2,132 | $196,900 | $38,000 | $158,900 |
| 2016 | $2,129 | $196,900 | $38,000 | $158,900 |
| 2015 | $2,096 | $0 | $0 | $0 |
Source: Public Records
Map
Nearby Homes
- 19449 Smith Cir
- 19986 Oak Leaf Cir
- 19816 Oak Leaf Cir
- 19417 Center St
- 19924 Floral Ln
- 20724 Catawba Ave Unit 11
- Lot 9 Meridian St Unit 9
- 19512 Meridian St
- 19901 Burton Ln
- 19930 Weeping Water Run Unit 19D
- 21724 Aftonshire Dr
- 21252 Hickory St
- 19524 Feriba Place
- 19631 Oak St
- 19623 Oak St
- 10205 Danesway Ln
- 20127 Beard St
- 20230 N Main St
- 20128 Zion Ave
- 19431 Heartland St
- 19449 Smith Cir Unit 2
- 19443 Smith Cir Unit 3
- 19500 Smith Cir
- 19509 Smith Cir
- 19437 Smith Cir Unit 4
- 19515 Smith Cir
- 19438 Smith Cir
- 19508 Smith Cir
- 21075 Nannie Potts Ln
- 19315 Smith Cir
- 19315 Smith Cir Unit 6
- 19525 Smith Cir
- 19516 Smith Cir
- 19307 Smith Cir
- 19537 Smith Cir
- 21074 Nannie Potts Ln
- 21074 Nannie Potts Ln
- 21074 Nannie Potts Ln Unit Lot 7
- 4.7 Ac Smith Cir
- 4.6 Ac Smith Cir
Your Personal Tour Guide
Ask me questions while you tour the home.