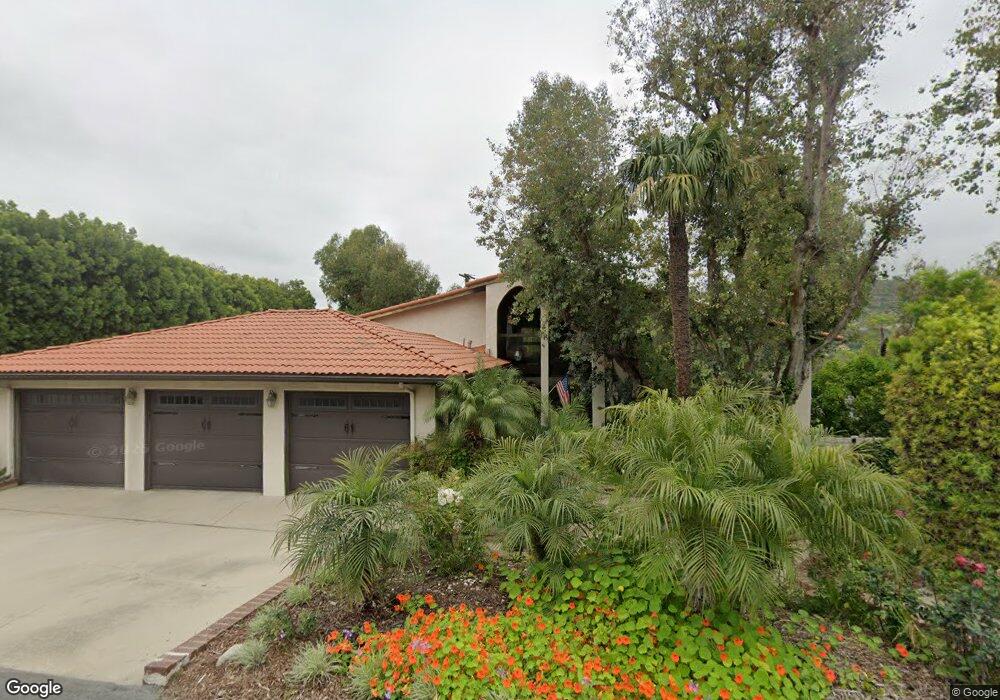
19461 Doris Way Santa Ana, CA 92705
Estimated Value: $1,730,000 - $2,137,000
4
Beds
4
Baths
2,894
Sq Ft
$666/Sq Ft
Est. Value
About This Home
This home is located at 19461 Doris Way, Santa Ana, CA 92705 and is currently estimated at $1,928,349, approximately $666 per square foot. 19461 Doris Way is a home located in Orange County with nearby schools including Arroyo Elementary School, Hewes Middle School, and Foothill High School.
Ownership History
Date
Name
Owned For
Owner Type
Purchase Details
Closed on
Feb 23, 2018
Sold by
Besta John Joseph and Besta Jean Wanell
Bought by
Besta John Joseph and Besta Jean Wanell
Current Estimated Value
Purchase Details
Closed on
Aug 16, 1996
Sold by
Lynn Gordon Deborah
Bought by
Besta John J and Besta Jean W
Home Financials for this Owner
Home Financials are based on the most recent Mortgage that was taken out on this home.
Original Mortgage
$302,000
Outstanding Balance
$23,915
Interest Rate
8.23%
Estimated Equity
$1,904,434
Purchase Details
Closed on
Jul 11, 1994
Sold by
Gabelsberg James F and Gabelsberg Della A
Bought by
Gordon Deborah Lynn
Home Financials for this Owner
Home Financials are based on the most recent Mortgage that was taken out on this home.
Original Mortgage
$330,000
Interest Rate
5.12%
Create a Home Valuation Report for This Property
The Home Valuation Report is an in-depth analysis detailing your home's value as well as a comparison with similar homes in the area
Home Values in the Area
Average Home Value in this Area
Purchase History
| Date | Buyer | Sale Price | Title Company |
|---|---|---|---|
| Besta John Joseph | -- | None Available | |
| Besta John J | $377,500 | Guardian Title Company | |
| Gordon Deborah Lynn | $385,000 | Guardian Title |
Source: Public Records
Mortgage History
| Date | Status | Borrower | Loan Amount |
|---|---|---|---|
| Open | Besta John J | $302,000 | |
| Previous Owner | Gordon Deborah Lynn | $330,000 |
Source: Public Records
Tax History Compared to Growth
Tax History
| Year | Tax Paid | Tax Assessment Tax Assessment Total Assessment is a certain percentage of the fair market value that is determined by local assessors to be the total taxable value of land and additions on the property. | Land | Improvement |
|---|---|---|---|---|
| 2025 | $7,535 | $614,822 | $289,096 | $325,726 |
| 2024 | $7,535 | $602,767 | $283,427 | $319,340 |
| 2023 | $7,320 | $590,949 | $277,870 | $313,079 |
| 2022 | $6,599 | $579,362 | $272,421 | $306,941 |
| 2021 | $6,466 | $568,002 | $267,079 | $300,923 |
| 2020 | $6,432 | $562,178 | $264,340 | $297,838 |
| 2019 | $6,274 | $551,155 | $259,156 | $291,999 |
| 2018 | $6,171 | $540,349 | $254,075 | $286,274 |
| 2017 | $6,063 | $529,754 | $249,093 | $280,661 |
| 2016 | $5,954 | $519,367 | $244,209 | $275,158 |
| 2015 | $6,010 | $511,566 | $240,541 | $271,025 |
| 2014 | $5,856 | $501,546 | $235,830 | $265,716 |
Source: Public Records
Map
Nearby Homes
- 12782 Periwinkle Dr
- 19542 Marcy Dr
- 10662 S Crawford Canyon Rd
- 12551 Barrett Ln
- 13121 Lemon Leaf Ln
- 19381 Lemon Cir
- 19201 Barrett Ln
- 19151 Fowler Ave
- 10436 Crawford Canyon Rd
- 19351 Lemon Hill Dr
- 12233 Circula Panorama
- 19031 Fowler Ave
- 12235 Circula Panorama
- 19402 Lemon Hill Dr
- 12254 Circula Panorama
- 10841 Hideaway Dr
- 12661 Vista Panorama
- 18945 Fowler Ave
- 19261 Brae Glen
- 12270 Circula Panorama
- 19451 Doris Way
- 19462 Doris Way
- 19452 Doris Way
- 19511 Holiday Ln
- 12791 Barrett Ln
- 12831 Barrett Ln
- 12801 Barrett Ln
- 12781 Barrett Ln
- 12802 Periwinkle Dr
- 19461 Holiday Ln
- 12761 Periwinkle Dr
- 12761 Barrett Ln
- 12811 Barrett Ln
- 19432 Holiday Ln
- 19431 Holiday Ln
- 12752 Periwinkle Dr
- 12871 Barrett Ln
- 12822 Periwinkle Dr
- 19441 Holiday Ln
- 12753 Periwinkle Dr