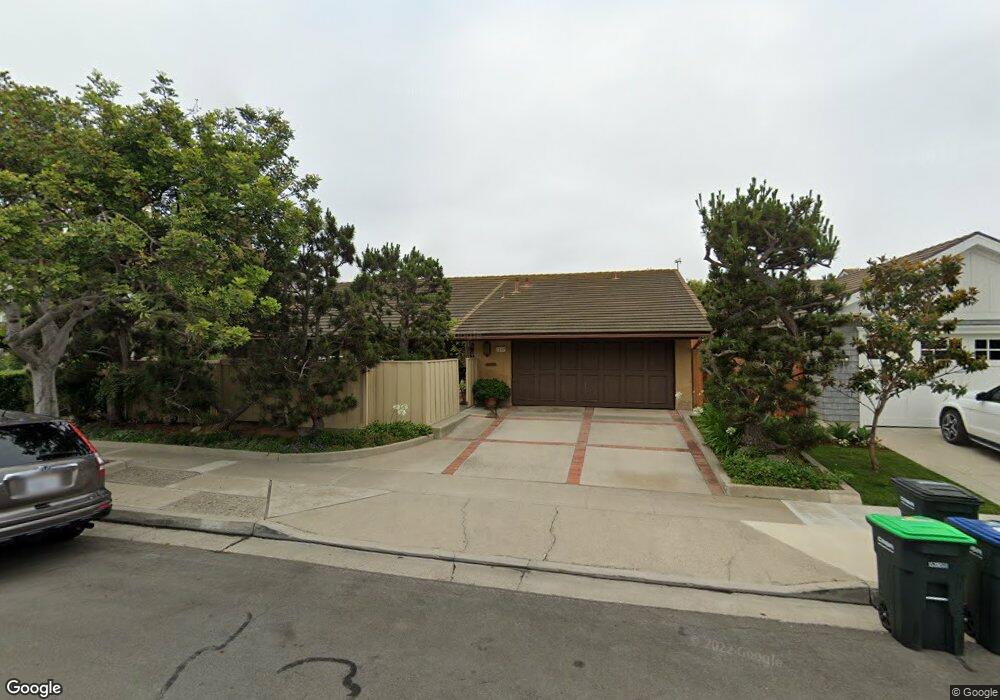
1947 Port Cardiff Place Newport Beach, CA 92660
Harbor View Homes NeighborhoodEstimated Value: $2,878,000 - $3,312,000
3
Beds
2
Baths
1,488
Sq Ft
$2,048/Sq Ft
Est. Value
About This Home
This home is located at 1947 Port Cardiff Place, Newport Beach, CA 92660 and is currently estimated at $3,046,742, approximately $2,047 per square foot. 1947 Port Cardiff Place is a home located in Orange County with nearby schools including Roy O. Andersen Elementary School, Corona del Mar Middle and High School, and Newport Christian School.
Ownership History
Date
Name
Owned For
Owner Type
Purchase Details
Closed on
Jun 23, 2016
Sold by
Mccormick Stephen D and Mccormick Kim S
Bought by
Mccormick Stephen D and Mccormick Kim S
Current Estimated Value
Purchase Details
Closed on
Jun 3, 2010
Sold by
Mccormick Stephen D and Mccormick Kim S
Bought by
Mccormick Stephen and Mccormick Kim
Home Financials for this Owner
Home Financials are based on the most recent Mortgage that was taken out on this home.
Original Mortgage
$183,000
Interest Rate
4.82%
Mortgage Type
New Conventional
Purchase Details
Closed on
Jan 19, 2006
Sold by
Mccormick Stephen D and Mccormick Kim S
Bought by
Mccormick Stephen D and Mccormick Kim S
Create a Home Valuation Report for This Property
The Home Valuation Report is an in-depth analysis detailing your home's value as well as a comparison with similar homes in the area
Home Values in the Area
Average Home Value in this Area
Purchase History
| Date | Buyer | Sale Price | Title Company |
|---|---|---|---|
| Mccormick Stephen D | -- | None Available | |
| Mccormick Stephen D | -- | None Available | |
| Mccormick Stephen | -- | Nations Title Company | |
| Mccormick Stephen D | -- | None Available |
Source: Public Records
Mortgage History
| Date | Status | Borrower | Loan Amount |
|---|---|---|---|
| Closed | Mccormick Stephen | $183,000 |
Source: Public Records
Tax History Compared to Growth
Tax History
| Year | Tax Paid | Tax Assessment Tax Assessment Total Assessment is a certain percentage of the fair market value that is determined by local assessors to be the total taxable value of land and additions on the property. | Land | Improvement |
|---|---|---|---|---|
| 2025 | $3,631 | $321,010 | $208,928 | $112,082 |
| 2024 | $3,631 | $314,716 | $204,831 | $109,885 |
| 2023 | $3,541 | $308,546 | $200,815 | $107,731 |
| 2022 | $3,477 | $302,497 | $196,878 | $105,619 |
| 2021 | $3,411 | $296,566 | $193,017 | $103,549 |
| 2020 | $3,377 | $293,526 | $191,038 | $102,488 |
| 2019 | $3,312 | $287,771 | $187,292 | $100,479 |
| 2018 | $3,247 | $282,129 | $183,620 | $98,509 |
| 2017 | $3,190 | $276,598 | $180,020 | $96,578 |
| 2016 | $3,120 | $271,175 | $176,490 | $94,685 |
| 2015 | $3,087 | $267,102 | $173,839 | $93,263 |
| 2014 | $3,014 | $261,870 | $170,433 | $91,437 |
Source: Public Records
Map
Nearby Homes
- 1845 Port Westbourne Place
- 15 Boardwalk
- 1812 Port Margate Place
- 10 Seabluff
- 1736 Port Sheffield Place
- 50 Whitehall
- 58 Victoria
- 2703 Hillside Dr Unit 36
- 1700 Port Margate Place
- 17 Monaco Unit 12
- 2720 Hilltop Dr Unit 58
- 1949 Port Seabourne Way
- 5 Hillsborough
- 515 Bay Hill Dr
- 2 Royal Saint George Rd
- 1963 Port Edward Place
- 38 Royal Saint George Rd
- 29 Augusta Ln
- 26 Coventry Unit 25
- 49 Canyon Island Dr
- 1953 Port Cardiff Place
- 1941 Port Cardiff Place
- 1936 Port Bristol Cir
- 1948 Port Bristol Cir
- 1935 Port Cardiff Place
- 1959 Port Cardiff Place
- 1930 Port Bristol Cir
- 1954 Port Bristol Cir
- 1944 Port Cardiff Place
- 1950 Port Cardiff Place
- 1927 Port Cardiff Place
- 1965 Port Cardiff Place
- 1938 Port Cardiff Place
- 1924 Port Bristol Cir
- 1956 Port Cardiff Place
- 1960 Port Bristol Cir
- 1930 Port Cardiff Place
- 1945 Port Bristol Cir
- 1962 Port Cardiff Place
- 1951 Port Bristol Cir