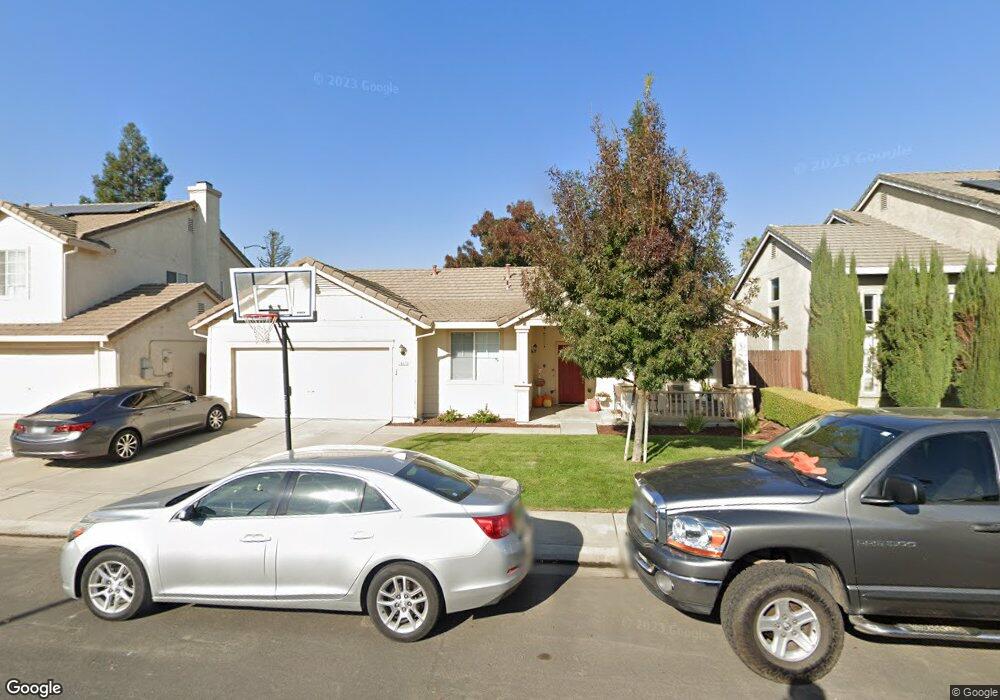
1947 Reading Way Manteca, CA 95337
Estimated Value: $472,371 - $521,000
3
Beds
2
Baths
1,299
Sq Ft
$387/Sq Ft
Est. Value
About This Home
This home is located at 1947 Reading Way, Manteca, CA 95337 and is currently estimated at $503,093, approximately $387 per square foot. 1947 Reading Way is a home located in San Joaquin County with nearby schools including Brock Elliott Elementary School and Sierra High School.
Ownership History
Date
Name
Owned For
Owner Type
Purchase Details
Closed on
Apr 19, 2000
Sold by
Foggiato Peter A and Foggiato Lucill
Bought by
Dalen Christopher and Dalen Jennifer K
Current Estimated Value
Home Financials for this Owner
Home Financials are based on the most recent Mortgage that was taken out on this home.
Original Mortgage
$143,200
Outstanding Balance
$49,095
Interest Rate
8.24%
Estimated Equity
$453,998
Purchase Details
Closed on
Jun 10, 1996
Sold by
Morrison Homes
Bought by
Foggiato Peter A and Foggiato Lucille K
Home Financials for this Owner
Home Financials are based on the most recent Mortgage that was taken out on this home.
Original Mortgage
$131,489
Interest Rate
8.01%
Mortgage Type
FHA
Create a Home Valuation Report for This Property
The Home Valuation Report is an in-depth analysis detailing your home's value as well as a comparison with similar homes in the area
Purchase History
We collect this data history from publicly available records. To have your information removed, we recommend requesting removal directly through your county’s website.
| Date | Buyer | Sale Price | Title Company |
|---|---|---|---|
| Dalen Christopher | $179,000 | Old Republic Title Company | |
| Foggiato Peter A | $133,500 | Old Republic Title Company |
Source: Public Records
Mortgage History
We collect this data history from publicly available records. To have your information removed, we recommend requesting removal directly through your county’s website.
| Date | Status | Borrower | Loan Amount |
|---|---|---|---|
| Open | Dalen Christopher | $143,200 | |
| Previous Owner | Foggiato Peter A | $131,489 |
Source: Public Records
Tax History
| Year | Tax Paid | Tax Assessment Tax Assessment Total Assessment is a certain percentage of the fair market value that is determined by local assessors to be the total taxable value of land and additions on the property. | Land | Improvement |
|---|---|---|---|---|
| 2025 | $3,001 | $275,102 | $69,157 | $205,945 |
| 2024 | $3,265 | $269,708 | $67,801 | $201,907 |
| 2023 | $3,222 | $264,421 | $66,472 | $197,949 |
| 2022 | $3,177 | $259,237 | $65,169 | $194,068 |
| 2021 | $3,145 | $254,155 | $63,892 | $190,263 |
| 2020 | $3,031 | $251,550 | $63,237 | $188,313 |
| 2019 | $2,995 | $246,619 | $61,998 | $184,621 |
| 2018 | $2,958 | $241,784 | $60,783 | $181,001 |
| 2017 | $2,919 | $237,044 | $59,592 | $177,452 |
| 2016 | $2,856 | $232,398 | $58,424 | $173,974 |
| 2014 | $2,677 | $224,423 | $56,419 | $168,004 |
Source: Public Records
Map
Nearby Homes
- 1752 Sierra Brook Ct
- 441 Avendale Dr
- 1785 Flaxen Ct
- 1164 Silver Brook Place
- 1137 Hidden Meadow Place
- 308 Ashford Ave
- 625 Bounty Place
- 1565 Daniels St
- 800 Treasure Ln
- 1781 Goldpoppy St
- 2256 W Yosemite Ave
- 1403 Sextant Way
- 1929 Sparrowhawk St
- 1412 Red Ribbons Ln
- 1264 Parkview St
- 140 Swanson Rd
- 1567 Purple Martin Ln
- 380 N Airport Way
- 232 Swanson Rd
- 1616 Langum Way
- 1955 Reading Way
- 1939 Reading Way
- 1963 Reading Way
- 1931 Reading Way
- 1946 Reading Way
- 1954 Reading Way
- 1938 Reading Way
- 1962 Reading Way
- 1977 Reading Way
- 1930 Reading Way
- 1965 Wawona St
- 1923 Reading Way
- 1976 Reading Way
- 1945 Box Car Dr
- 1953 Box Car Dr
- 1937 Box Car Dr
- 1981 Reading Way
- 1961 Box Car Dr
- 1929 Box Car Dr
- 1010 Iron Horse Way
Your Personal Tour Guide
Ask me questions while you tour the home.