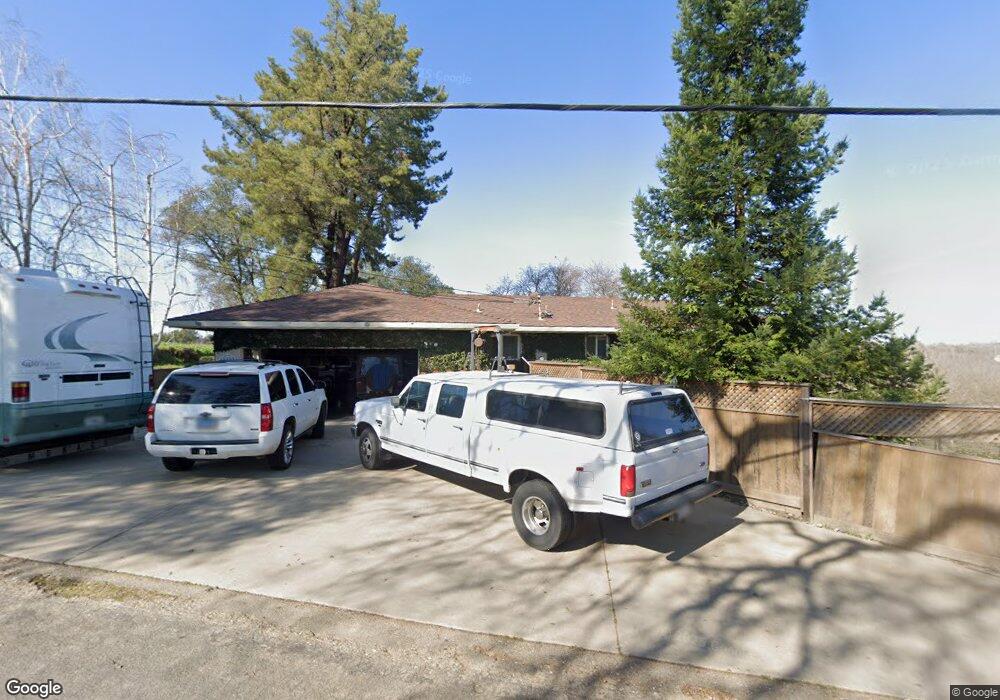
19493 E Mehrten Rd Clements, CA 95227
Estimated Value: $766,000 - $1,235,000
3
Beds
3
Baths
2,750
Sq Ft
$340/Sq Ft
Est. Value
About This Home
This home is located at 19493 E Mehrten Rd, Clements, CA 95227 and is currently estimated at $933,746, approximately $339 per square foot. 19493 E Mehrten Rd is a home located in San Joaquin County with nearby schools including Lockeford Elementary School and Lodi High School.
Ownership History
Date
Name
Owned For
Owner Type
Purchase Details
Closed on
Mar 3, 2020
Sold by
Blomeley Beverly
Bought by
Blomeley Beverly L and Akins Landa S
Current Estimated Value
Purchase Details
Closed on
Jan 31, 2018
Sold by
Blomeley Beverly L
Bought by
Blomeley Beverly L
Purchase Details
Closed on
Oct 31, 2011
Sold by
Hubbard Dianna L
Bought by
Blomeley Beverly L
Home Financials for this Owner
Home Financials are based on the most recent Mortgage that was taken out on this home.
Original Mortgage
$280,000
Interest Rate
4.02%
Mortgage Type
Purchase Money Mortgage
Purchase Details
Closed on
Nov 20, 2003
Sold by
Hubbard Stephen R and Hubbard Dianna L
Bought by
Hubbard Stephen R and Hubbard Dianna L
Create a Home Valuation Report for This Property
The Home Valuation Report is an in-depth analysis detailing your home's value as well as a comparison with similar homes in the area
Home Values in the Area
Average Home Value in this Area
Purchase History
| Date | Buyer | Sale Price | Title Company |
|---|---|---|---|
| Blomeley Beverly L | -- | None Available | |
| Blomeley Beverly L | -- | None Available | |
| Blomeley Beverly L | $350,000 | Placer Title Company | |
| Blomeley Beverly L | -- | Placer Title Company | |
| Hubbard Stephen R | -- | -- |
Source: Public Records
Mortgage History
| Date | Status | Borrower | Loan Amount |
|---|---|---|---|
| Previous Owner | Blomeley Beverly L | $280,000 |
Source: Public Records
Tax History Compared to Growth
Tax History
| Year | Tax Paid | Tax Assessment Tax Assessment Total Assessment is a certain percentage of the fair market value that is determined by local assessors to be the total taxable value of land and additions on the property. | Land | Improvement |
|---|---|---|---|---|
| 2025 | $4,837 | $439,606 | $125,599 | $314,007 |
| 2024 | $4,706 | $430,987 | $123,137 | $307,850 |
| 2023 | $4,653 | $422,537 | $120,723 | $301,814 |
| 2022 | $4,551 | $414,253 | $118,356 | $295,897 |
| 2021 | $4,632 | $406,132 | $116,036 | $290,096 |
| 2020 | $4,514 | $401,969 | $114,847 | $287,122 |
| 2019 | $4,424 | $394,089 | $112,596 | $281,493 |
| 2018 | $4,363 | $386,363 | $110,389 | $275,974 |
| 2017 | $4,267 | $378,788 | $108,225 | $270,563 |
| 2016 | $4,004 | $371,360 | $106,103 | $265,257 |
| 2014 | $3,904 | $358,620 | $102,463 | $256,157 |
Source: Public Records
Map
Nearby Homes
- 18529 E Hwy 88
- 23418 MacKville Rd
- 23595 N MacKville Rd
- 22191 Anderson St
- 30222 MacKville Rd
- 17755 E Collier Rd
- 21190 E Acampo Rd
- 24943 N Mcintire Rd
- 24521 N Mcintire Rd
- 19007 E Sierra View Ct
- 25045 N Mcintire Rd
- 22050 E Buena Vista Rd
- 22555 E Buena Vista Rd
- 19505 Atkins Rd
- 18739 Clements Rd
- 9999-lot 3 Fuhrman Rd
- 14267 E Peltier Rd
- 23303 Buena Vista Rd
- 114 Pomace Dr
- 14537 Miravista Ln
- 19493 Mehrten Rd
- 19233 E Mehrten Rd
- 21024 E Hwy 12 Rd
- 23301 N MacKville Rd
- 18397 E Hwy 88
- 18315 E Hwy 88
- 18595 E Highway 88
- 18945 Highway 88
- 18401 E Hwy 88
- 18625 E Highway 88
- 18397 E Highway 88
- 18485 E Hwy 88
- 18435 E Hwy 88
- 18511 E Hwy 88
- 18511 E Hwy 88
- 18595 E Hwy 88
- 18625 E Hwy 88
- 18401 E Hwy 88
- 23005 N MacKville Rd
- 11818 N MacKville Rd