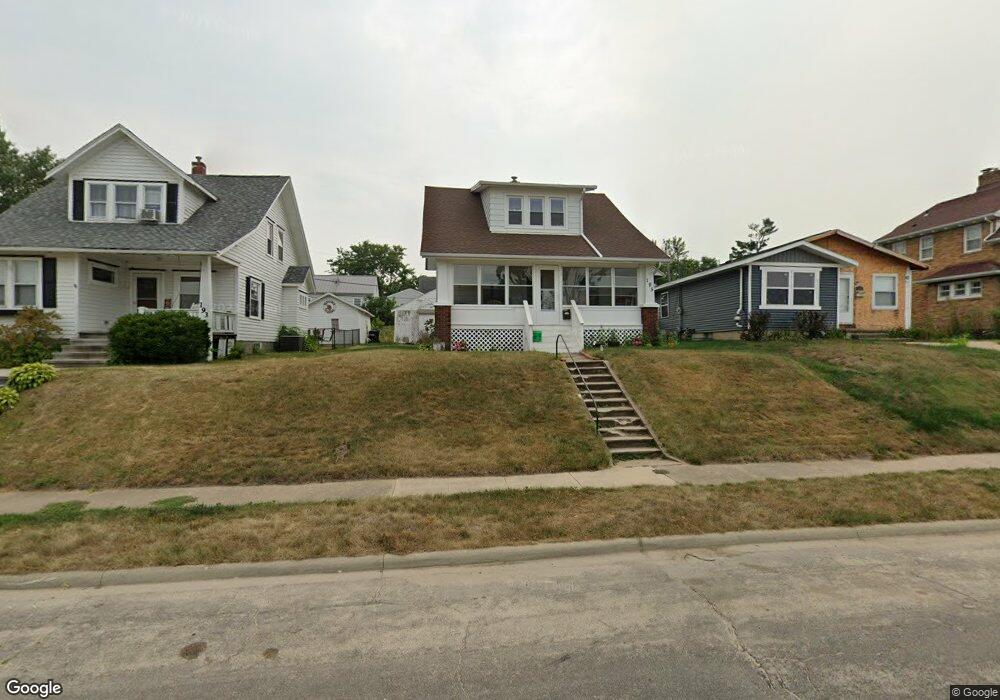
195 21st Ave SW Cedar Rapids, IA 52404
Southwest Area NeighborhoodEstimated Value: $156,000 - $183,000
3
Beds
1
Bath
1,247
Sq Ft
$131/Sq Ft
Est. Value
About This Home
This home is located at 195 21st Ave SW, Cedar Rapids, IA 52404 and is currently estimated at $163,277, approximately $130 per square foot. 195 21st Ave SW is a home located in Linn County with nearby schools including Junction City Elementary School, Grant Elementary School, and Bruce Hall Day Treatment Center.
Ownership History
Date
Name
Owned For
Owner Type
Purchase Details
Closed on
Jan 9, 2009
Sold by
Jamison Jennifer S
Bought by
Roob Joshua K
Current Estimated Value
Home Financials for this Owner
Home Financials are based on the most recent Mortgage that was taken out on this home.
Original Mortgage
$105,071
Outstanding Balance
$65,870
Interest Rate
5.19%
Mortgage Type
FHA
Estimated Equity
$97,407
Purchase Details
Closed on
May 24, 2005
Sold by
Dean Robert B and Dean Shannon L
Bought by
Roob Joshua K and Jamison Jennifer S
Home Financials for this Owner
Home Financials are based on the most recent Mortgage that was taken out on this home.
Original Mortgage
$105,664
Interest Rate
6.07%
Mortgage Type
FHA
Purchase Details
Closed on
Sep 29, 2000
Sold by
Jennings Nancy A and Loesel Tim
Bought by
Dean Robert B and Dean Shannon L
Home Financials for this Owner
Home Financials are based on the most recent Mortgage that was taken out on this home.
Original Mortgage
$83,378
Interest Rate
7.98%
Mortgage Type
FHA
Create a Home Valuation Report for This Property
The Home Valuation Report is an in-depth analysis detailing your home's value as well as a comparison with similar homes in the area
Home Values in the Area
Average Home Value in this Area
Purchase History
| Date | Buyer | Sale Price | Title Company |
|---|---|---|---|
| Roob Joshua K | -- | None Available | |
| Roob Joshua K | $106,000 | -- | |
| Dean Robert B | $83,000 | -- |
Source: Public Records
Mortgage History
| Date | Status | Borrower | Loan Amount |
|---|---|---|---|
| Open | Roob Joshua K | $105,071 | |
| Previous Owner | Roob Joshua K | $105,664 | |
| Previous Owner | Dean Robert B | $83,378 |
Source: Public Records
Tax History Compared to Growth
Tax History
| Year | Tax Paid | Tax Assessment Tax Assessment Total Assessment is a certain percentage of the fair market value that is determined by local assessors to be the total taxable value of land and additions on the property. | Land | Improvement |
|---|---|---|---|---|
| 2025 | $2,186 | $141,300 | $29,500 | $111,800 |
| 2024 | $2,380 | $133,300 | $24,000 | $109,300 |
| 2023 | $2,380 | $134,000 | $21,900 | $112,100 |
| 2022 | $2,128 | $121,700 | $21,900 | $99,800 |
| 2021 | $2,118 | $111,700 | $21,900 | $89,800 |
| 2020 | $2,118 | $104,600 | $21,900 | $82,700 |
| 2019 | $2,014 | $102,000 | $18,600 | $83,400 |
| 2018 | $1,956 | $102,000 | $18,600 | $83,400 |
| 2017 | $2,135 | $98,900 | $18,600 | $80,300 |
| 2016 | $2,135 | $100,500 | $18,600 | $81,900 |
| 2015 | $2,163 | $101,682 | $18,577 | $83,105 |
| 2014 | $1,978 | $104,252 | $18,577 | $85,675 |
| 2013 | $1,986 | $104,252 | $18,577 | $85,675 |
Source: Public Records
Map
Nearby Homes
- 186 22nd Ave SW
- 2021 Hamilton St SW
- 1906 K St SW
- 2448 2nd St SW
- 2401 Victoria Dr SW
- 192 15th Ave SW
- 1411 1st St SW
- 280 14th Ave SW
- 2601 Teresa Dr SW
- 1323 M St SW
- 1435 N St SW
- 2818 Southland St SW
- 2212 Deborah Dr SW
- 1426 N St SW
- 1300 M St SW
- 1119 3rd St SW
- 2937 Southland St SW
- 51 29th Avenue Dr SW Unit D11
- 51 29th Avenue Dr SW Unit C22
- 648 22nd Ave SW
- 197 21st Ave SW
- 193 21st Ave SW
- 199 21st Ave SW
- 191 21st Ave SW
- 194 22nd Ave SW
- 196 22nd Ave SW
- 192 22nd Ave SW
- 2023 2nd St SW
- 2121 2nd St SW
- 190 22nd Ave SW
- 192 21st Ave SW
- 188 22nd Ave SW
- 2019 2nd St SW
- 187 21st Ave SW
- 190 21st Ave SW
- 2011 2nd St SW
- 185 21st Ave SW
- 186 21st Ave SW
- 184 22nd Ave SW
- 2201 2nd St SW