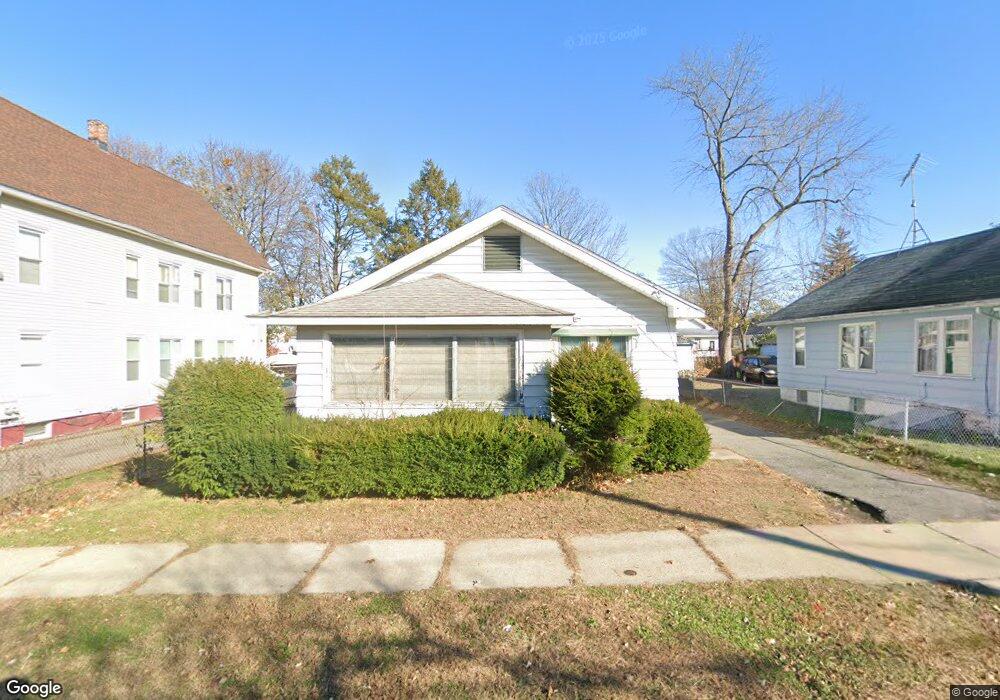
195 Jasper St Springfield, MA 01109
Pine Point NeighborhoodEstimated Value: $137,000 - $213,161
2
Beds
1
Bath
902
Sq Ft
$181/Sq Ft
Est. Value
About This Home
This home is located at 195 Jasper St, Springfield, MA 01109 and is currently estimated at $163,040, approximately $180 per square foot. 195 Jasper St is a home located in Hampden County with nearby schools including Hiram L. Dorman Elementary, John F. Kennedy Academy, and Springfield Central High School.
Ownership History
Date
Name
Owned For
Owner Type
Purchase Details
Closed on
Jul 7, 2025
Sold by
Mack Na Servicing T and Conway
Bought by
Olmsted Realty Llc
Current Estimated Value
Purchase Details
Closed on
Apr 28, 2025
Sold by
Lma Realty Llc
Bought by
Mack Na Servicing T and Conway
Purchase Details
Closed on
Oct 24, 2008
Sold by
Galeas James P
Bought by
Lma Realty Llc
Purchase Details
Closed on
May 22, 2008
Sold by
Shriners Hosp Chldren and Harris
Bought by
Galeas James P
Create a Home Valuation Report for This Property
The Home Valuation Report is an in-depth analysis detailing your home's value as well as a comparison with similar homes in the area
Home Values in the Area
Average Home Value in this Area
Purchase History
| Date | Buyer | Sale Price | Title Company |
|---|---|---|---|
| Olmsted Realty Llc | $140,000 | -- | |
| Olmsted Realty Llc | $140,000 | -- | |
| Mack Na Servicing T | $85,000 | None Available | |
| Mack Na Servicing T | $85,000 | None Available | |
| Lma Realty Llc | -- | -- | |
| Lma Realty Llc | -- | -- | |
| Lma Realty Llc | -- | -- | |
| Galeas James P | $48,000 | -- | |
| Galeas James P | $48,000 | -- | |
| Galeas James P | $48,000 | -- |
Source: Public Records
Tax History Compared to Growth
Tax History
| Year | Tax Paid | Tax Assessment Tax Assessment Total Assessment is a certain percentage of the fair market value that is determined by local assessors to be the total taxable value of land and additions on the property. | Land | Improvement |
|---|---|---|---|---|
| 2025 | $2,981 | $190,100 | $39,100 | $151,000 |
| 2024 | $2,663 | $165,800 | $32,600 | $133,200 |
| 2023 | $2,743 | $160,900 | $29,600 | $131,300 |
| 2022 | $2,836 | $150,700 | $27,700 | $123,000 |
| 2021 | $2,523 | $133,500 | $25,200 | $108,300 |
| 2020 | $2,390 | $122,400 | $25,200 | $97,200 |
| 2019 | $2,464 | $125,200 | $25,200 | $100,000 |
| 2018 | $2,125 | $108,000 | $25,200 | $82,800 |
| 2017 | $2,098 | $106,700 | $23,300 | $83,400 |
| 2016 | $2,151 | $109,400 | $23,300 | $86,100 |
| 2015 | $1,997 | $101,500 | $23,300 | $78,200 |
Source: Public Records
Map
Nearby Homes