Estimated Value: $585,645 - $682,000
4
Beds
3
Baths
2,024
Sq Ft
$310/Sq Ft
Est. Value
About This Home
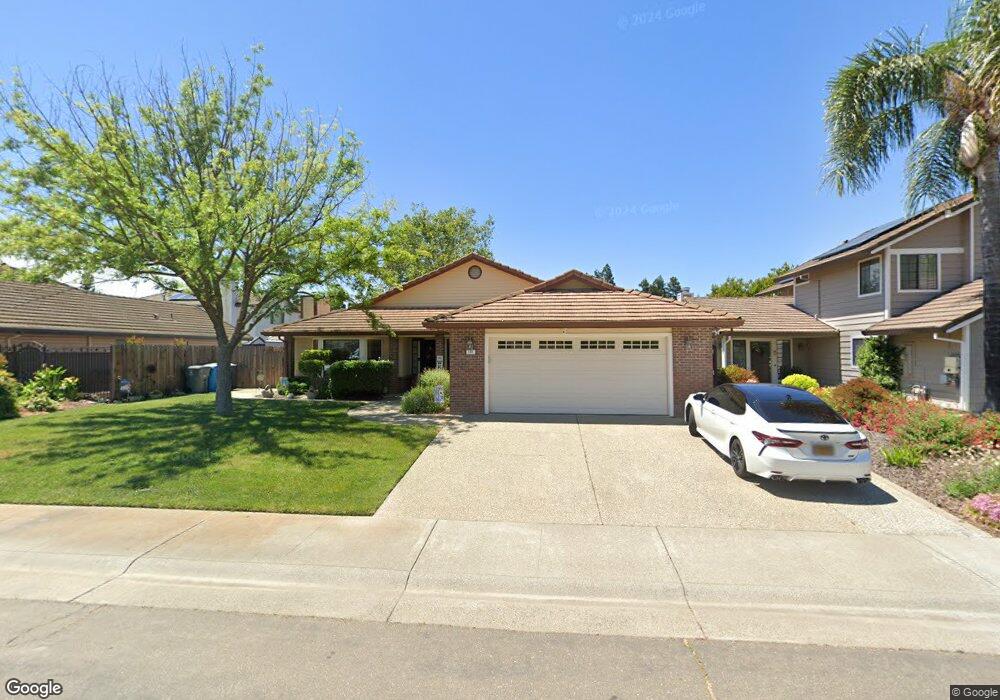
This home is located at 195 Lynd Way, Dixon, CA 95620 and is currently estimated at $627,161, approximately $309 per square foot. 195 Lynd Way is a home located in Solano County with nearby schools including Tremont Elementary School, Dixon High School, and Dixon Montessori Charter.
Ownership History
Date
Name
Owned For
Owner Type
Purchase Details
Closed on
Jun 25, 2018
Sold by
Jacob Kevin Eugene and Jacob Rebecca Frances
Bought by
Jacobs Kevin Eugene and Frances Rebecca
Current Estimated Value
Purchase Details
Closed on
Jul 15, 2014
Sold by
Jacobs Kevin E and Jacobs Rebecca F
Bought by
Jacobs Kevin E and Jacobs Rebecca F
Home Financials for this Owner
Home Financials are based on the most recent Mortgage that was taken out on this home.
Original Mortgage
$292,000
Interest Rate
4.1%
Mortgage Type
New Conventional
Create a Home Valuation Report for This Property
The Home Valuation Report is an in-depth analysis detailing your home's value as well as a comparison with similar homes in the area
Home Values in the Area
Average Home Value in this Area
Purchase History
| Date | Buyer | Sale Price | Title Company |
|---|---|---|---|
| Jacobs Kevin Eugene | -- | None Available | |
| Jacobs Kevin E | -- | Old Republic Title Company |
Source: Public Records
Mortgage History
| Date | Status | Borrower | Loan Amount |
|---|---|---|---|
| Closed | Jacobs Kevin E | $292,000 |
Source: Public Records
Tax History
| Year | Tax Paid | Tax Assessment Tax Assessment Total Assessment is a certain percentage of the fair market value that is determined by local assessors to be the total taxable value of land and additions on the property. | Land | Improvement |
|---|---|---|---|---|
| 2025 | $4,239 | $372,751 | $104,021 | $268,730 |
| 2024 | $4,239 | $365,443 | $101,982 | $263,461 |
| 2023 | $4,114 | $358,279 | $99,983 | $258,296 |
| 2022 | $4,052 | $351,255 | $98,023 | $253,232 |
| 2021 | $4,001 | $344,368 | $96,101 | $248,267 |
| 2020 | $3,936 | $340,838 | $95,116 | $245,722 |
| 2019 | $3,862 | $334,155 | $93,251 | $240,904 |
| 2018 | $3,844 | $327,604 | $91,423 | $236,181 |
| 2017 | $3,748 | $321,181 | $89,631 | $231,550 |
| 2016 | $3,586 | $314,884 | $87,874 | $227,010 |
| 2015 | $3,504 | $310,156 | $86,555 | $223,601 |
| 2014 | $3,465 | $304,081 | $84,860 | $219,221 |
Source: Public Records
Map
Nearby Homes
- 1315 Jacobs Place
- 1150 Mulberry Ln
- 1365 Jacobs Place
- 1155 Mulberry Ln
- 1250 Redwood Ct
- 1315 Pinewood Ct
- 1330 Blackberry Ct
- 550 N Lincoln St
- 1310 Hawthorne Ct
- 265 Ahern Ln
- 775 Cahill Ct
- 1530 Ferrero Dr
- 795 Michele Ct
- 650 W C St
- 689 W C St
- 625 Peony Ct
- 1025 Mason Ct
- 675 Brians Way
- 970 Camelia Dr
- 1500 Goldfield Ct
Your Personal Tour Guide
Ask me questions while you tour the home.