195 Stratford Ave Ventura, CA 93003
College NeighborhoodEstimated Value: $973,475 - $1,215,000
2
Beds
2
Baths
1,360
Sq Ft
$780/Sq Ft
Est. Value
About This Home
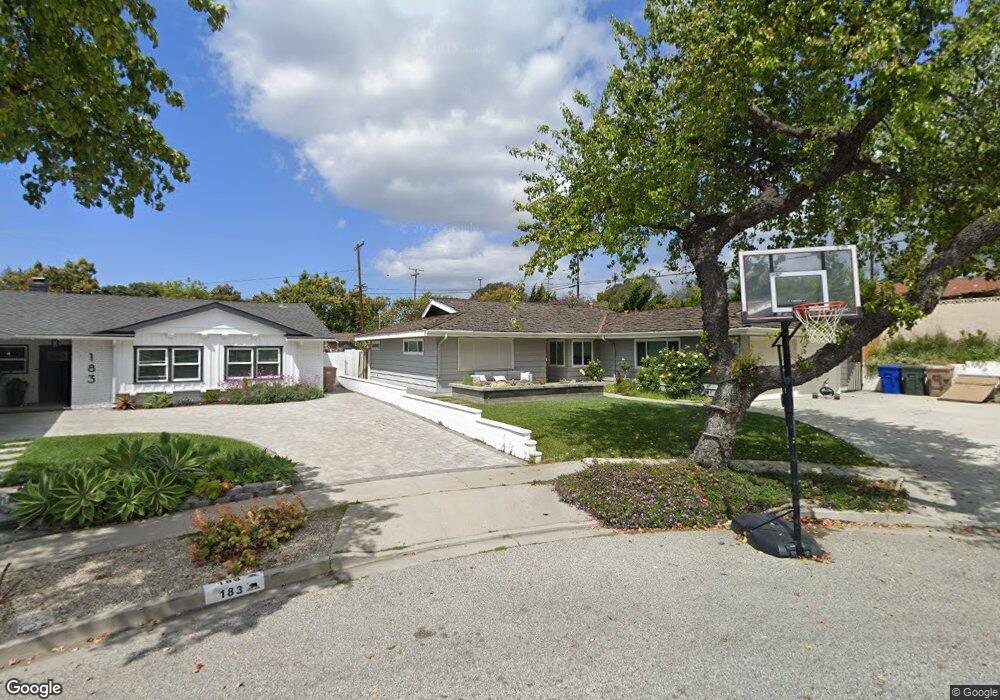
This home is located at 195 Stratford Ave, Ventura, CA 93003 and is currently estimated at $1,060,369, approximately $779 per square foot. 195 Stratford Ave is a home located in Ventura County with nearby schools including Poinsettia Elementary School, Anacapa Middle School, and Buena High School.
Ownership History
Date
Name
Owned For
Owner Type
Purchase Details
Closed on
Nov 1, 2018
Sold by
Gateley Sandra L and The Gateley Family Trust
Bought by
Savala Justin A and Savala Tracy E
Current Estimated Value
Home Financials for this Owner
Home Financials are based on the most recent Mortgage that was taken out on this home.
Original Mortgage
$500,000
Outstanding Balance
$438,751
Interest Rate
4.7%
Mortgage Type
Purchase Money Mortgage
Estimated Equity
$621,618
Purchase Details
Closed on
Sep 15, 2005
Sold by
Gateley Jon L and Gateley Sandra L
Bought by
Gateley Jon L and Gateley Sandra L
Purchase Details
Closed on
Mar 22, 1999
Sold by
Harrington Ronald G
Bought by
Gateley Jon L and Gately Sandra L
Home Financials for this Owner
Home Financials are based on the most recent Mortgage that was taken out on this home.
Original Mortgage
$210,000
Interest Rate
6.79%
Mortgage Type
Seller Take Back
Purchase Details
Closed on
Dec 3, 1998
Sold by
Harrington Ronald G
Bought by
Harrington Ronald G
Purchase Details
Closed on
Jul 11, 1995
Sold by
Gene Lisa Crane
Bought by
Gene Albert Charles
Create a Home Valuation Report for This Property
The Home Valuation Report is an in-depth analysis detailing your home's value as well as a comparison with similar homes in the area
Home Values in the Area
Average Home Value in this Area
Purchase History
| Date | Buyer | Sale Price | Title Company |
|---|---|---|---|
| Savala Justin A | $552,500 | Chicago Title Co | |
| Gateley Jon L | -- | -- | |
| Gateley Jon L | $235,000 | American Title Co | |
| Harrington Ronald G | -- | -- | |
| Gene Albert Charles | -- | -- |
Source: Public Records
Mortgage History
| Date | Status | Borrower | Loan Amount |
|---|---|---|---|
| Open | Savala Justin A | $500,000 | |
| Previous Owner | Gateley Jon L | $210,000 |
Source: Public Records
Tax History Compared to Growth
Tax History
| Year | Tax Paid | Tax Assessment Tax Assessment Total Assessment is a certain percentage of the fair market value that is determined by local assessors to be the total taxable value of land and additions on the property. | Land | Improvement |
|---|---|---|---|---|
| 2025 | $7,671 | $719,506 | $467,401 | $252,105 |
| 2024 | $7,671 | $705,399 | $458,237 | $247,162 |
| 2023 | $7,584 | $691,568 | $449,252 | $242,316 |
| 2022 | $7,046 | $678,008 | $440,443 | $237,565 |
| 2021 | $6,924 | $664,714 | $431,807 | $232,907 |
| 2020 | $6,860 | $657,900 | $427,380 | $230,520 |
| 2019 | $6,734 | $645,000 | $419,000 | $226,000 |
| 2018 | $3,487 | $323,766 | $241,107 | $82,659 |
| 2017 | $3,424 | $317,419 | $236,380 | $81,039 |
| 2016 | $3,365 | $311,196 | $231,746 | $79,450 |
| 2015 | $3,312 | $306,523 | $228,266 | $78,257 |
| 2014 | $3,266 | $300,521 | $223,796 | $76,725 |
Source: Public Records
Map
Nearby Homes
- 275 Fairfax Ave
- 262 Crestwood Ave
- 288 Byron Ave
- 5633 Pembroke St
- 412 Dayloma Ave
- 201 Xavier Ave
- 4797 Loma Vista Rd
- 572 Skyline Rd
- 5365 Queens St
- 5438 Rainier St
- 6005 Sutter St
- 322 S Victoria Ave
- 6019 Cloverly St
- 159 Donner Ave
- 6174 Cobblestone Dr
- 146 Donner Ave
- 6153 Cobblestone Dr
- 91 Mount Whitney Ct
- 373 S Brookshire Ave
- 311 Rodgers St Unit 311
- 183 Stratford Ave
- 171 Stratford Ave
- 5353 Loma Vista Rd
- 198 Stratford Ave
- 190 Teloma Dr
- 5399 Loma Vista Rd
- 174 Teloma Dr
- 5327 Loma Vista Rd
- 182 Stratford Ave
- 159 Stratford Ave
- 5401 Byron Ave
- 166 Teloma Dr
- 215 Fairfax Ave
- 5301 Loma Vista Rd
- 5366 Avon St
- 5382 Avon St
- 147 Stratford Ave
- 160 Teloma Dr
- 5465 Byron Ave
- 225 Fairfax Ave