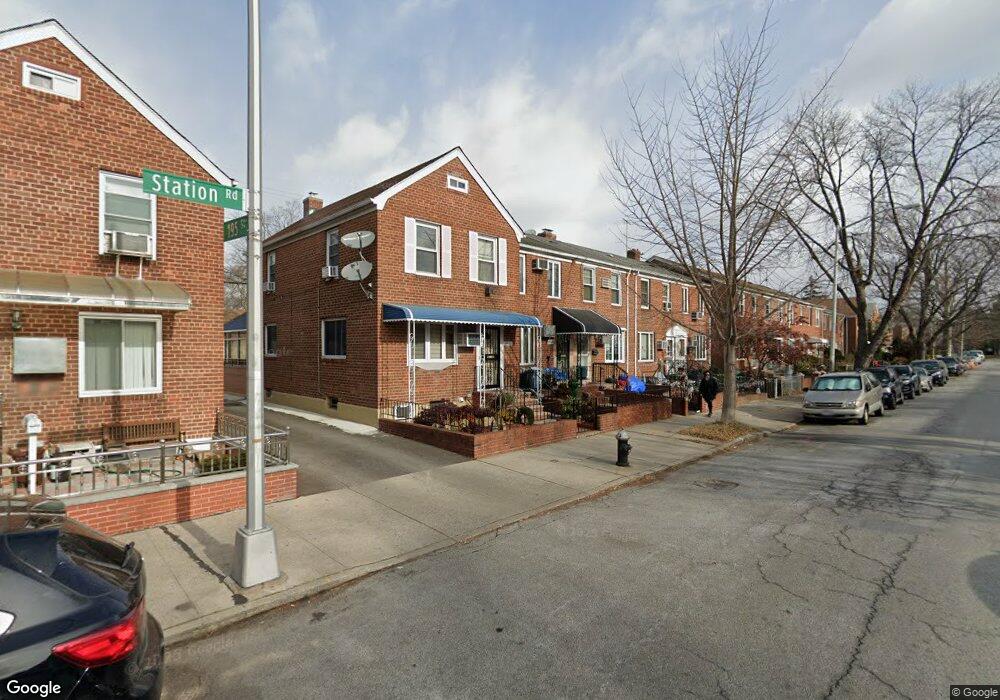
19501 Station Rd Flushing, NY 11358
Auburndale NeighborhoodEstimated Value: $827,000 - $951,000
Studio
--
Bath
1,224
Sq Ft
$736/Sq Ft
Est. Value
About This Home
This home is located at 19501 Station Rd, Flushing, NY 11358 and is currently estimated at $900,645, approximately $735 per square foot. 19501 Station Rd is a home located in Queens County with nearby schools including P.S. 31 - Bayside, I.S. 25 Adrien Block, and Francis Lewis High School.
Ownership History
Date
Name
Owned For
Owner Type
Purchase Details
Closed on
Jan 31, 2019
Sold by
Oh Choong Hwan and Oh Christina
Bought by
Lin Meisu
Current Estimated Value
Home Financials for this Owner
Home Financials are based on the most recent Mortgage that was taken out on this home.
Original Mortgage
$460,000
Outstanding Balance
$402,791
Interest Rate
4.5%
Mortgage Type
New Conventional
Estimated Equity
$497,854
Purchase Details
Closed on
Mar 12, 2008
Sold by
Chan Shuk Mei Lisa and Wong Michael
Bought by
Oh Choong Hwan and Oh Christina
Home Financials for this Owner
Home Financials are based on the most recent Mortgage that was taken out on this home.
Original Mortgage
$70,000
Interest Rate
5.76%
Purchase Details
Closed on
Oct 9, 2001
Sold by
Ali Shareen
Bought by
Wong Michael and Chan Shuk Mei Lisa
Home Financials for this Owner
Home Financials are based on the most recent Mortgage that was taken out on this home.
Original Mortgage
$230,000
Interest Rate
6.7%
Purchase Details
Closed on
Sep 24, 1996
Sold by
Novik Atzmon
Bought by
Ali Shareen
Create a Home Valuation Report for This Property
The Home Valuation Report is an in-depth analysis detailing your home's value as well as a comparison with similar homes in the area
Home Values in the Area
Average Home Value in this Area
Purchase History
| Date | Buyer | Sale Price | Title Company |
|---|---|---|---|
| Lin Meisu | $769,000 | -- | |
| Oh Choong Hwan | $520,000 | -- | |
| Oh Choong Hwan | $520,000 | -- | |
| Wong Michael | -- | -- | |
| Wong Michael | -- | -- | |
| Ali Shareen | $160,000 | -- | |
| Ali Shareen | $160,000 | -- |
Source: Public Records
Mortgage History
| Date | Status | Borrower | Loan Amount |
|---|---|---|---|
| Open | Lin Meisu | $460,000 | |
| Previous Owner | Oh Choong Hwan | $70,000 | |
| Previous Owner | Oh Choong Hwan | $346,000 | |
| Previous Owner | Wong Michael | $230,000 |
Source: Public Records
Tax History
| Year | Tax Paid | Tax Assessment Tax Assessment Total Assessment is a certain percentage of the fair market value that is determined by local assessors to be the total taxable value of land and additions on the property. | Land | Improvement |
|---|---|---|---|---|
| 2025 | $7,204 | $38,020 | $10,772 | $27,248 |
| 2024 | $7,204 | $35,868 | $12,180 | $23,688 |
| 2023 | $6,797 | $33,840 | $9,704 | $24,136 |
| 2022 | $4,828 | $45,840 | $14,160 | $31,680 |
| 2021 | $6,786 | $48,540 | $14,160 | $34,380 |
| 2020 | $6,706 | $46,140 | $14,160 | $31,980 |
| 2019 | $6,253 | $49,860 | $14,160 | $35,700 |
| 2018 | $5,749 | $28,200 | $8,909 | $19,291 |
| 2017 | $5,478 | $26,872 | $9,742 | $17,130 |
| 2016 | $5,372 | $26,872 | $9,742 | $17,130 |
| 2015 | $2,838 | $26,403 | $15,372 | $11,031 |
| 2014 | $2,838 | $24,909 | $14,065 | $10,844 |
Source: Public Records
Map
Nearby Homes
- 194-23 Station Rd
- 195-33 39th Ave
- 4032 195th St
- 195-31 39th Ave
- 193-02 39th Ave Unit 1
- 40-38 194th St Unit 1A
- 4038 194th St Unit 3B
- 37-6 Francis Lewis Blvd
- 37-02 Francis Lewis Blvd
- 37-08 Francis Lewis Blvd
- 4048 194th St Unit A3
- 192-14 Station Rd
- 3617 194th St
- 19112 Station Rd
- 36- 40 201st St Unit A, B, C
- 191-9 39th Ave Unit 164
- 36-20 194th St Unit 3r
- 191-02 39th Ave
- 190-05 39th Ave Unit 142
- 190-17 42nd Ave
- 19503 Station Rd
- 19427 Station Rd
- 194-25 Station Rd
- 19505 Station Rd
- 195-01 Station Rd
- 19425 Station Rd
- 19507 Station Rd
- 19421 Station Rd
- 19423 Station Rd
- 19509 Station Rd
- 19421 Station Rd
- 19511 Station Rd
- 194-17 Station Rd
- 19419 Station Rd
- 19513 Station Rd
- 195-13 Station Rd
- 19415 Station Rd
- 19417 Station Rd
- 19515 Station Rd
- 195-08 Station Rd Unit 4
Your Personal Tour Guide
Ask me questions while you tour the home.