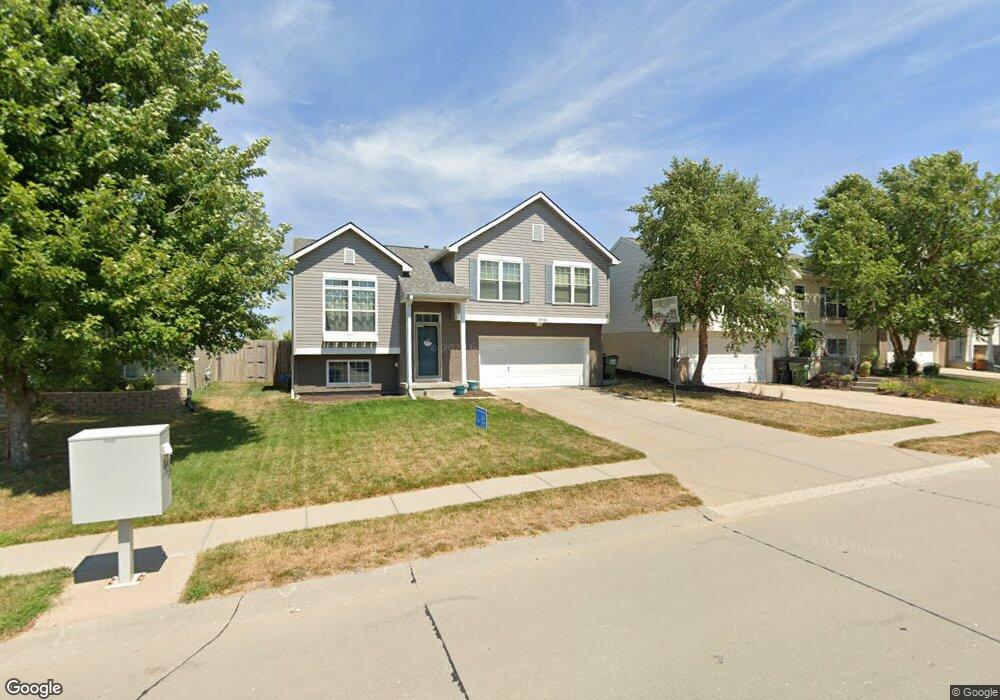
19510 U St Omaha, NE 68135
Southwest Omaha NeighborhoodEstimated Value: $227,000 - $262,603
3
Beds
2
Baths
1,048
Sq Ft
$233/Sq Ft
Est. Value
About This Home
This home is located at 19510 U St, Omaha, NE 68135 and is currently estimated at $244,651, approximately $233 per square foot. 19510 U St is a home located in Douglas County with nearby schools including Gretna Middle School and Gretna High School.
Ownership History
Date
Name
Owned For
Owner Type
Purchase Details
Closed on
Nov 20, 2020
Sold by
Brown Malissa A
Bought by
Brown Myles R
Current Estimated Value
Home Financials for this Owner
Home Financials are based on the most recent Mortgage that was taken out on this home.
Original Mortgage
$146,520
Outstanding Balance
$130,848
Interest Rate
3%
Mortgage Type
FHA
Estimated Equity
$113,803
Purchase Details
Closed on
Feb 22, 2007
Sold by
Hearthstone Homes Inc
Bought by
Brown Myles R
Purchase Details
Closed on
Aug 16, 2006
Sold by
Boyer Young Equities Iii
Bought by
Hearthstone Homes
Create a Home Valuation Report for This Property
The Home Valuation Report is an in-depth analysis detailing your home's value as well as a comparison with similar homes in the area
Home Values in the Area
Average Home Value in this Area
Purchase History
| Date | Buyer | Sale Price | Title Company |
|---|---|---|---|
| Brown Myles R | -- | None Available | |
| Brown Myles R | $112,500 | -- | |
| Hearthstone Homes | $245,300 | -- |
Source: Public Records
Mortgage History
| Date | Status | Borrower | Loan Amount |
|---|---|---|---|
| Open | Brown Myles R | $146,520 |
Source: Public Records
Tax History Compared to Growth
Tax History
| Year | Tax Paid | Tax Assessment Tax Assessment Total Assessment is a certain percentage of the fair market value that is determined by local assessors to be the total taxable value of land and additions on the property. | Land | Improvement |
|---|---|---|---|---|
| 2025 | $4,493 | $219,500 | $24,300 | $195,200 |
| 2024 | $4,965 | $219,500 | $24,300 | $195,200 |
| 2023 | $4,965 | $205,000 | $24,300 | $180,700 |
| 2022 | $4,468 | $170,800 | $24,300 | $146,500 |
| 2021 | $4,383 | $170,800 | $24,300 | $146,500 |
| 2020 | $3,989 | $149,600 | $24,300 | $125,300 |
| 2019 | $4,056 | $149,600 | $24,300 | $125,300 |
| 2018 | $3,783 | $139,400 | $24,300 | $115,100 |
| 2017 | $3,678 | $131,200 | $24,300 | $106,900 |
| 2016 | $3,447 | $122,400 | $20,000 | $102,400 |
| 2015 | $3,403 | $122,400 | $20,000 | $102,400 |
| 2014 | $3,403 | $122,400 | $20,000 | $102,400 |
Source: Public Records
Map
Nearby Homes
- 20001 V St
- 19822 V St
- 20044 V St
- 20043 V St
- 20125 U St
- 20113 U St Unit Lot 113
- 19351 V St
- 20064 R St Unit Lot 1
- 5725 S 199th Cir
- 19371 X St
- 21307 Y St
- 19905 V St
- 5811 S 200 St
- 5717 S 200th Cir
- 5818 S 200 Cir
- 6107 S 197th St
- 5702 S 200th Cir Unit LOT 219
- 5702 S 200th Cir
- 5518 S 200th Ave
- 5513 S 200 Ave