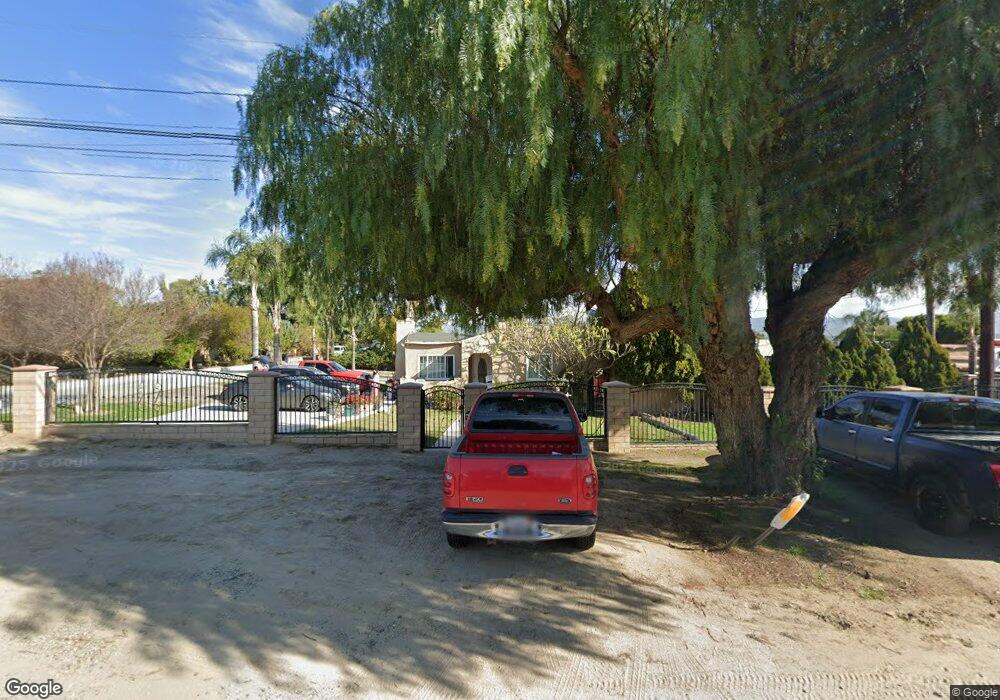
19512 El Rivino Rd Riverside, CA 92509
Estimated Value: $473,000 - $912,376
2
Beds
1
Bath
2,246
Sq Ft
$295/Sq Ft
Est. Value
About This Home
This home is located at 19512 El Rivino Rd, Riverside, CA 92509 and is currently estimated at $661,844, approximately $294 per square foot. 19512 El Rivino Rd is a home located in San Bernardino County with nearby schools including Ina Arbuckle Elementary School, Mission Middle School, and Rubidoux High School.
Ownership History
Date
Name
Owned For
Owner Type
Purchase Details
Closed on
Sep 22, 2021
Sold by
Jay Gees Llc
Bought by
Aleka Group Llc
Current Estimated Value
Purchase Details
Closed on
Oct 20, 2011
Sold by
Onewest Bank Fsb
Bought by
Jay Gees Llc
Purchase Details
Closed on
Feb 16, 2010
Sold by
Federal Deposit Insurance Corporation
Bought by
Onewest Bank Fsb
Purchase Details
Closed on
Nov 23, 2009
Sold by
Flores Ron and Flores Guadalupe
Bought by
First Federal Bank Of California
Purchase Details
Closed on
Jan 16, 2003
Sold by
Flores Ron and Flores Guadalupe
Bought by
Flores Ron and Flores Guadalupe
Home Financials for this Owner
Home Financials are based on the most recent Mortgage that was taken out on this home.
Original Mortgage
$171,000
Interest Rate
5.95%
Create a Home Valuation Report for This Property
The Home Valuation Report is an in-depth analysis detailing your home's value as well as a comparison with similar homes in the area
Home Values in the Area
Average Home Value in this Area
Purchase History
| Date | Buyer | Sale Price | Title Company |
|---|---|---|---|
| Aleka Group Llc | -- | First American Title | |
| Jay Gees Llc | $165,000 | Lsi Title Company | |
| Onewest Bank Fsb | -- | Stewart Title Co | |
| First Federal Bank Of California | $100,000 | Servicelink | |
| Flores Ron | -- | Gateway Title |
Source: Public Records
Mortgage History
| Date | Status | Borrower | Loan Amount |
|---|---|---|---|
| Previous Owner | Flores Ron | $171,000 |
Source: Public Records
Tax History Compared to Growth
Tax History
| Year | Tax Paid | Tax Assessment Tax Assessment Total Assessment is a certain percentage of the fair market value that is determined by local assessors to be the total taxable value of land and additions on the property. | Land | Improvement |
|---|---|---|---|---|
| 2025 | $8,351 | $689,786 | $212,242 | $477,544 |
| 2024 | $8,351 | $676,260 | $208,080 | $468,180 |
| 2023 | $8,369 | $663,000 | $204,000 | $459,000 |
| 2022 | $2,606 | $650,000 | $200,000 | $450,000 |
| 2021 | $2,651 | $191,465 | $87,029 | $104,436 |
| 2020 | $2,657 | $189,502 | $86,137 | $103,365 |
| 2019 | $2,589 | $185,786 | $84,448 | $101,338 |
| 2018 | $2,393 | $182,143 | $82,792 | $99,351 |
| 2017 | $2,309 | $178,572 | $81,169 | $97,403 |
| 2016 | $2,367 | $175,070 | $79,577 | $95,493 |
| 2015 | $2,292 | $172,441 | $78,382 | $94,059 |
| 2014 | $2,202 | $169,064 | $76,847 | $92,217 |
Source: Public Records
Map
Nearby Homes
- 5258 El Rivino Rd
- 815 Aqua Mansa Rd
- 11317 Lilac Ave
- 18863 8th St
- 19585 Jurupa Ave
- 19398 Jurupa Ave
- 19474 Jurupa Ave
- 3130 Industrial Dr
- 11291 Cactus Ave
- 11241 Cactus Ave
- 18670 9th St
- 2725 Hall Ave
- 18765 Jurupa Ave
- 18493 8th St
- 18470 7th St
- 18605 13th St
- 10945 Trenmar Ln
- 18456 10th St
- 4557 Snake River Rd
- Residence Two Plan at Emerald Ridge - Overlook
- 19522 El Rivino Rd
- 5332 El Rivino Rd
- 19476 El Rivino Rd
- 5318 El Rivino Rd
- 19454 El Rivino Rd
- 5352 El Rivino Rd
- 19522 El Rivino Rd
- 19608 El Rivino Rd
- 19624 El Rivino Rd
- 5280 El Rivino Rd
- 19410 El Rivino Rd
- 19640 El Rivino Rd
- 19390 El Rivino Rd Unit E
- 19390 El Rivino Rd
- 19572 El Rivino Rd
- 19384 El Rivino Rd
- 5290 El Rivino Rd
- 19360 El Rivino Rd
- 19584 County Line Rd
- 19746 El Rivino Rd