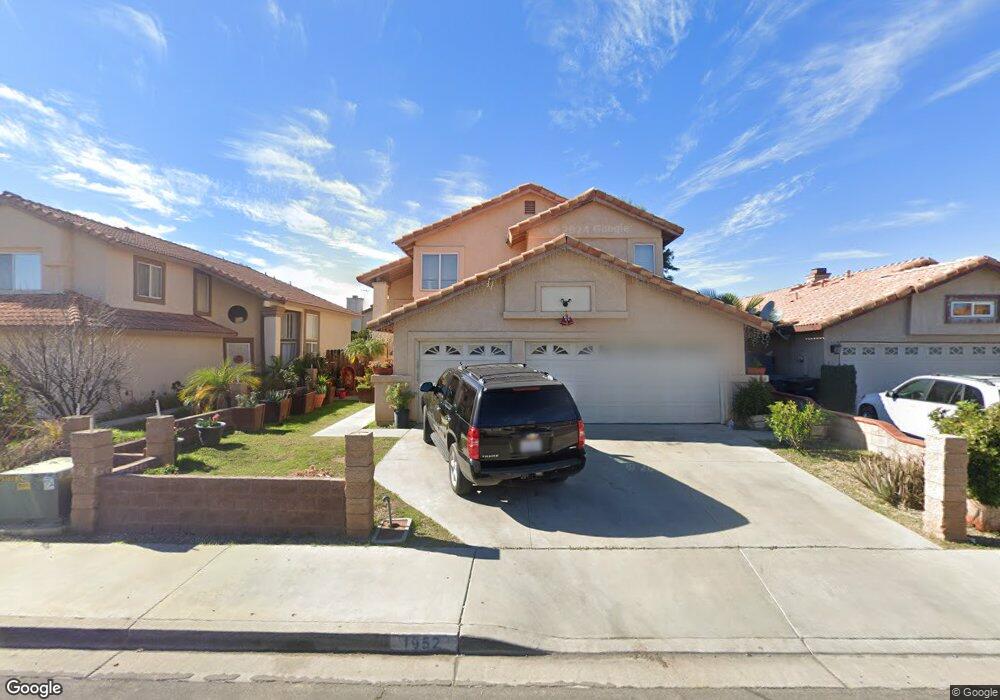
1952 Miramar St Perris, CA 92571
Central Perris NeighborhoodEstimated Value: $489,000 - $518,000
4
Beds
3
Baths
1,635
Sq Ft
$305/Sq Ft
Est. Value
About This Home
This home is located at 1952 Miramar St, Perris, CA 92571 and is currently estimated at $499,308, approximately $305 per square foot. 1952 Miramar St is a home located in Riverside County with nearby schools including Palms Elementary School, Pinacate Middle School, and Perris High School.
Ownership History
Date
Name
Owned For
Owner Type
Purchase Details
Closed on
Dec 1, 2009
Sold by
Patel Makbulahmed I
Bought by
Sah Properties Llc
Current Estimated Value
Purchase Details
Closed on
Sep 22, 2009
Sold by
Patel Nasimbanu M
Bought by
Patel Makbulahmed I
Purchase Details
Closed on
Jul 15, 2009
Sold by
Sanchez Jose M and Vera Margarita
Bought by
One West Bank Fsb
Purchase Details
Closed on
Jan 19, 2006
Sold by
Sanchez Jose
Bought by
Vera Margarita
Purchase Details
Closed on
Sep 28, 2004
Sold by
Reyes Alfonso C and Reyes Soledad S
Bought by
Sanchez Jose M and Vera Margarita
Home Financials for this Owner
Home Financials are based on the most recent Mortgage that was taken out on this home.
Original Mortgage
$198,750
Interest Rate
5.76%
Mortgage Type
Purchase Money Mortgage
Create a Home Valuation Report for This Property
The Home Valuation Report is an in-depth analysis detailing your home's value as well as a comparison with similar homes in the area
Home Values in the Area
Average Home Value in this Area
Purchase History
| Date | Buyer | Sale Price | Title Company |
|---|---|---|---|
| Sah Properties Llc | -- | None Available | |
| Patel Makbulahmed I | -- | Chicago Title Company | |
| Patel Makbulahmed I | $130,000 | Chicago Title Company | |
| One West Bank Fsb | $111,544 | Lps | |
| Vera Margarita | -- | None Available | |
| Sanchez Jose M | $255,000 | New Century Title Company |
Source: Public Records
Mortgage History
| Date | Status | Borrower | Loan Amount |
|---|---|---|---|
| Previous Owner | Sanchez Jose M | $198,750 |
Source: Public Records
Tax History
| Year | Tax Paid | Tax Assessment Tax Assessment Total Assessment is a certain percentage of the fair market value that is determined by local assessors to be the total taxable value of land and additions on the property. | Land | Improvement |
|---|---|---|---|---|
| 2025 | $2,048 | $167,787 | $45,169 | $122,618 |
| 2023 | $2,048 | $161,273 | $43,416 | $117,857 |
| 2022 | $2,027 | $158,112 | $42,565 | $115,547 |
| 2021 | $1,991 | $155,013 | $41,731 | $113,282 |
| 2020 | $1,968 | $153,425 | $41,304 | $112,121 |
| 2019 | $1,926 | $150,418 | $40,495 | $109,923 |
| 2018 | $1,846 | $147,469 | $39,701 | $107,768 |
| 2017 | $2,174 | $144,578 | $38,923 | $105,655 |
| 2016 | $2,167 | $141,744 | $38,160 | $103,584 |
| 2015 | $2,155 | $139,617 | $37,588 | $102,029 |
| 2014 | $2,126 | $136,884 | $36,852 | $100,032 |
Source: Public Records
Map
Nearby Homes
- 377 Aurora Dr
- 2248 Ridge Ct
- 1826 Avenida San Sebastian
- 1777 Amethyst Dr
- 466 Granite View Dr
- 507 Coudures Way
- 129 Olivetree Dr
- 1829 Springtree Dr
- 1676 Amethyst Dr
- 544 Turquoise Dr
- 1942 Sandcastle Dr
- 2231 Flash Ct
- 2070 Dayflower Ct
- 1562 Remembrance Dr
- 575 Prairie Way
- 21500 Orange Creek Rd
- 166 Ambrosia Ct
- 1509 Portrait St
- 1491 Portrait St
- 767 Clearwater Dr
- 1964 Miramar St
- 1936 Miramar St
- 1953 Hennesy St
- 1949 Hennesy St
- 1965 Hennesy St
- 1924 Miramar St
- 1937 Hennesy St
- 1963 Miramar St
- 1951 Miramar St
- 1943 Miramar St
- 1971 Miramar St
- 1925 Hennesy St
- 288 Superior Ct
- 296 Superior Ct
- 1916 Miramar St
- 1935 Miramar St
- 280 Superior Ct
- 1979 Miramar St
- 272 Superior Ct
- 1917 Hennesy St
Your Personal Tour Guide
Ask me questions while you tour the home.