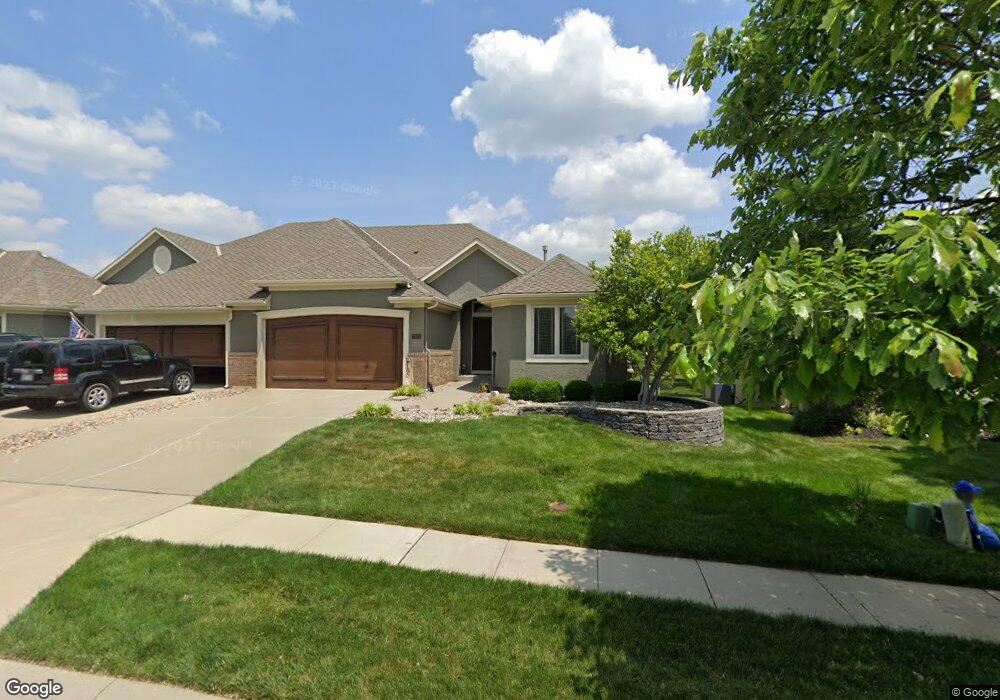
19520 W 100th Terrace Lenexa, KS 66220
Estimated Value: $487,631 - $545,000
3
Beds
3
Baths
1,565
Sq Ft
$331/Sq Ft
Est. Value
About This Home
This home is located at 19520 W 100th Terrace, Lenexa, KS 66220 and is currently estimated at $518,408, approximately $331 per square foot. 19520 W 100th Terrace is a home located in Johnson County with nearby schools including Manchester Park Elementary School, Prairie Trail Middle School, and Olathe Northwest High School.
Ownership History
Date
Name
Owned For
Owner Type
Purchase Details
Closed on
Feb 22, 2024
Sold by
Floyd Stephen H
Bought by
Stephen H Floyd Living Trust and Floyd
Current Estimated Value
Purchase Details
Closed on
Feb 5, 2010
Sold by
95Th Street Service Corp
Bought by
Floyd Stephen H
Home Financials for this Owner
Home Financials are based on the most recent Mortgage that was taken out on this home.
Original Mortgage
$225,000
Interest Rate
5.16%
Mortgage Type
Future Advance Clause Open End Mortgage
Purchase Details
Closed on
Jun 18, 2009
Sold by
Dakota Inc
Bought by
95Th Street Service Corp
Purchase Details
Closed on
Feb 28, 2006
Sold by
Falcon Valley Llc
Bought by
Dakota Inc
Home Financials for this Owner
Home Financials are based on the most recent Mortgage that was taken out on this home.
Original Mortgage
$255,850
Interest Rate
6.19%
Mortgage Type
Construction
Create a Home Valuation Report for This Property
The Home Valuation Report is an in-depth analysis detailing your home's value as well as a comparison with similar homes in the area
Home Values in the Area
Average Home Value in this Area
Purchase History
| Date | Buyer | Sale Price | Title Company |
|---|---|---|---|
| Stephen H Floyd Living Trust | -- | None Listed On Document | |
| Floyd Stephen H | -- | First American Title Ins Co | |
| 95Th Street Service Corp | -- | Kansas City Title | |
| Dakota Inc | -- | Kansas City Title |
Source: Public Records
Mortgage History
| Date | Status | Borrower | Loan Amount |
|---|---|---|---|
| Previous Owner | Floyd Stephen H | $225,000 | |
| Previous Owner | Dakota Inc | $255,850 |
Source: Public Records
Tax History Compared to Growth
Tax History
| Year | Tax Paid | Tax Assessment Tax Assessment Total Assessment is a certain percentage of the fair market value that is determined by local assessors to be the total taxable value of land and additions on the property. | Land | Improvement |
|---|---|---|---|---|
| 2024 | $6,098 | $49,703 | $6,408 | $43,295 |
| 2023 | $6,096 | $48,680 | $6,408 | $42,272 |
| 2022 | $5,991 | $46,655 | $4,931 | $41,724 |
| 2021 | $5,810 | $43,010 | $4,931 | $38,079 |
| 2020 | $5,536 | $40,572 | $4,931 | $35,641 |
| 2019 | $5,828 | $42,423 | $7,155 | $35,268 |
| 2018 | $5,490 | $42,297 | $7,155 | $35,142 |
| 2017 | $5,275 | $37,122 | $4,293 | $32,829 |
| 2016 | $4,974 | $35,788 | $4,089 | $31,699 |
| 2015 | $4,331 | $31,119 | $4,089 | $27,030 |
| 2013 | -- | $31,234 | $4,089 | $27,145 |
Source: Public Records
Map
Nearby Homes
- 9835 Walker St
- 19220 W 98th Terrace
- 9844 Stevenson St
- 18932 W 100th St
- 18804 W 99th St
- 9917 Fountain Cir
- 18732 W 99th St
- 18637 W 97th Terrace
- 9500 Woodland Rd
- 0 W 95th St
- 20516 W 98th Place
- 20802 W 102nd St
- 9517 Falcon Ridge Dr
- 9705 Sunset Cir
- 20035 W 107th Terrace
- 22003 W 100th Terrace
- 20914 W 96th Terrace
- 20825 W 94th Terrace
- 20457 W 107th Terrace
- 10206 Theden Cir
- 19522 W 100th Terrace
- 19524 W 100th Terrace
- 19518 W 100th Terrace
- 19515 W 100th St
- 19526 W 100th Terrace
- 19516 W 100th Terrace
- 19519 W 100th St
- 19513 W 100th St
- 19510 W 100th Terrace
- 19521 W 100th Terrace
- 19523 W 100th Terrace
- 19601 W 100th St
- 19509 W 100th St
- 19602 W 100th Terrace
- 19517 W 100th Terrace
- 19507 W 100th St
- 19604 W 100th Terrace
- 19603 W 100th St
- 19515 W 100th Terrace
- 19603 W 100th Terrace