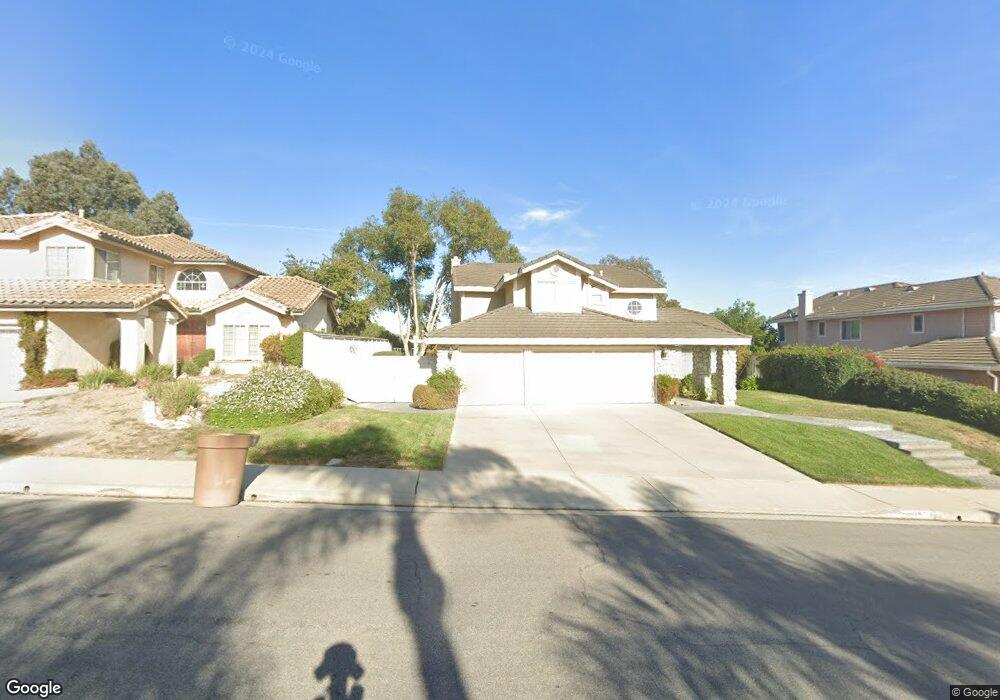
1958 Sierra Mesa Dr Camarillo, CA 93010
Estimated Value: $1,141,162 - $1,308,000
4
Beds
3
Baths
2,217
Sq Ft
$558/Sq Ft
Est. Value
About This Home
This home is located at 1958 Sierra Mesa Dr, Camarillo, CA 93010 and is currently estimated at $1,236,791, approximately $557 per square foot. 1958 Sierra Mesa Dr is a home located in Ventura County with nearby schools including Camarillo Heights Elementary School, Monte Vista Middle School, and Adolfo Camarillo High School.
Ownership History
Date
Name
Owned For
Owner Type
Purchase Details
Closed on
Feb 2, 2002
Sold by
Marcy Henry O and Marcy Paula Jean
Bought by
Mcguinness Conary H
Current Estimated Value
Home Financials for this Owner
Home Financials are based on the most recent Mortgage that was taken out on this home.
Original Mortgage
$290,000
Outstanding Balance
$120,674
Interest Rate
7.15%
Estimated Equity
$1,116,117
Purchase Details
Closed on
Mar 5, 1999
Sold by
Marcy Henry O and Marcy Paula J
Bought by
Marcy Henry O and Marcy Paula J
Home Financials for this Owner
Home Financials are based on the most recent Mortgage that was taken out on this home.
Original Mortgage
$255,000
Interest Rate
6.7%
Purchase Details
Closed on
Oct 31, 1996
Sold by
Wysocki Dennis J and Wysocki Geri L
Bought by
Marcy Henry O and Marcy Paula Jean
Home Financials for this Owner
Home Financials are based on the most recent Mortgage that was taken out on this home.
Original Mortgage
$245,600
Interest Rate
7.37%
Create a Home Valuation Report for This Property
The Home Valuation Report is an in-depth analysis detailing your home's value as well as a comparison with similar homes in the area
Home Values in the Area
Average Home Value in this Area
Purchase History
| Date | Buyer | Sale Price | Title Company |
|---|---|---|---|
| Mcguinness Conary H | $455,000 | Fidelity National Title Ins | |
| Marcy Henry O | -- | American Title Co | |
| Marcy Henry O | $307,000 | Gateway Title Company |
Source: Public Records
Mortgage History
| Date | Status | Borrower | Loan Amount |
|---|---|---|---|
| Open | Mcguinness Conary H | $290,000 | |
| Previous Owner | Marcy Henry O | $255,000 | |
| Previous Owner | Marcy Henry O | $245,600 |
Source: Public Records
Tax History
| Year | Tax Paid | Tax Assessment Tax Assessment Total Assessment is a certain percentage of the fair market value that is determined by local assessors to be the total taxable value of land and additions on the property. | Land | Improvement |
|---|---|---|---|---|
| 2025 | $7,425 | $672,144 | $268,856 | $403,288 |
| 2024 | $7,425 | $658,965 | $263,584 | $395,381 |
| 2023 | $7,149 | $646,045 | $258,416 | $387,629 |
| 2022 | $7,117 | $633,378 | $253,349 | $380,029 |
| 2021 | $6,843 | $620,959 | $248,381 | $372,578 |
| 2020 | $6,819 | $614,593 | $245,835 | $368,758 |
| 2019 | $6,787 | $602,543 | $241,015 | $361,528 |
| 2018 | $6,663 | $590,730 | $236,290 | $354,440 |
| 2017 | $6,273 | $579,148 | $231,657 | $347,491 |
| 2016 | $6,124 | $567,793 | $227,115 | $340,678 |
| 2015 | $6,059 | $559,265 | $223,704 | $335,561 |
| 2014 | $5,919 | $548,312 | $219,323 | $328,989 |
Source: Public Records
Map
Nearby Homes
- 157 Lantana St
- 154 Cerro Crest Dr
- 1487 Nordman Dr
- 253 Reddington Ct
- 25 Encino Ave
- 1524 Lyndhurst Ave
- 1075 Seybolt Ave
- 365 Valley Vista Dr
- 525 Valley Vista Dr
- 375 W Highland Dr
- 970 Sudario Ct
- 1709 Las Posas Rd
- 3118 Old Coach Dr
- 1557 Prima Ct
- 3181 Goldenspur Dr
- 85 Crestview Ave
- 91 Calle Escalon
- 1066 Pinehurst Place
- 676 W Highland Dr
- 1361 Calle Aurora
- 1942 Sierra Mesa Dr
- 1924 Sierra Mesa Dr
- 1990 Sierra Mesa Dr
- 787 Via Alcazar
- 760 Vista Coto Verde
- 1908 Sierra Mesa Dr
- 786 Via Alcazar
- 761 Via Alcazar
- 738 Vista Coto Verde
- 760 Via Alcazar
- 1900 Sierra Mesa Dr
- 739 Via Alcazar
- 712 Vista Coto Verde
- 801 Vista Coto Verde
- 753 Vista Coto Verde
- 811 Vista Coto Verde
- 738 Via Alcazar
- 769 Calle Higuera
- 731 Vista Coto Verde
- 837 Vista Coto Verde
Your Personal Tour Guide
Ask me questions while you tour the home.