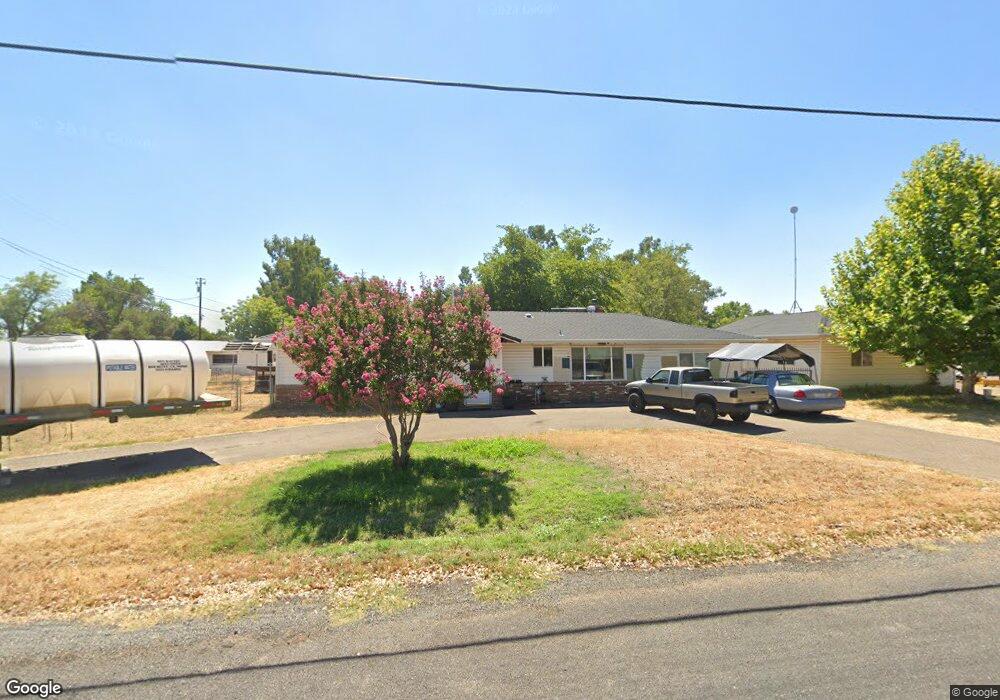
19585 Alta Vista Dr Red Bluff, CA 96080
Estimated Value: $317,000 - $392,000
4
Beds
2
Baths
1,584
Sq Ft
$223/Sq Ft
Est. Value
About This Home
This home is located at 19585 Alta Vista Dr, Red Bluff, CA 96080 and is currently estimated at $352,600, approximately $222 per square foot. 19585 Alta Vista Dr is a home located in Tehama County with nearby schools including William M. Metteer Elementary School, Vista Preparatory Academy, and Red Bluff High School.
Ownership History
Date
Name
Owned For
Owner Type
Purchase Details
Closed on
Feb 23, 2015
Sold by
Novak Matthew M
Bought by
Haynes Benjamin Scott and Haynes Holly R
Current Estimated Value
Home Financials for this Owner
Home Financials are based on the most recent Mortgage that was taken out on this home.
Original Mortgage
$185,443
Outstanding Balance
$141,192
Interest Rate
3.6%
Mortgage Type
VA
Estimated Equity
$211,408
Purchase Details
Closed on
Dec 23, 2014
Sold by
Novak Shawna M
Bought by
Novak Matthew M
Purchase Details
Closed on
Jun 22, 2012
Sold by
Cowan Robert H and Cowan Janet L
Bought by
Novak Matthew M and Novak Shawna M
Home Financials for this Owner
Home Financials are based on the most recent Mortgage that was taken out on this home.
Original Mortgage
$150,000
Interest Rate
3.74%
Mortgage Type
Seller Take Back
Purchase Details
Closed on
May 1, 2012
Sold by
Stinson Harry and Stinson Karen
Bought by
Cowan Robert H and Cowan Janet L
Home Financials for this Owner
Home Financials are based on the most recent Mortgage that was taken out on this home.
Original Mortgage
$150,000
Interest Rate
3.74%
Mortgage Type
Seller Take Back
Create a Home Valuation Report for This Property
The Home Valuation Report is an in-depth analysis detailing your home's value as well as a comparison with similar homes in the area
Home Values in the Area
Average Home Value in this Area
Purchase History
| Date | Buyer | Sale Price | Title Company |
|---|---|---|---|
| Haynes Benjamin Scott | $182,000 | Placer Title Co | |
| Novak Matthew M | -- | Placer Title Company | |
| Novak Matthew M | $150,000 | Placer Title Company | |
| Cowan Robert H | $110,000 | None Available |
Source: Public Records
Mortgage History
| Date | Status | Borrower | Loan Amount |
|---|---|---|---|
| Open | Haynes Benjamin Scott | $185,443 | |
| Previous Owner | Novak Matthew M | $150,000 |
Source: Public Records
Tax History Compared to Growth
Tax History
| Year | Tax Paid | Tax Assessment Tax Assessment Total Assessment is a certain percentage of the fair market value that is determined by local assessors to be the total taxable value of land and additions on the property. | Land | Improvement |
|---|---|---|---|---|
| 2025 | $2,146 | $218,174 | $78,116 | $140,058 |
| 2023 | $2,108 | $209,704 | $75,084 | $134,620 |
| 2022 | $2,093 | $205,593 | $73,612 | $131,981 |
| 2021 | $2,007 | $201,563 | $72,169 | $129,394 |
| 2020 | $2,048 | $199,497 | $71,429 | $128,068 |
| 2019 | $2,060 | $195,586 | $70,029 | $125,557 |
| 2018 | $1,903 | $191,752 | $68,656 | $123,096 |
| 2017 | $1,919 | $187,993 | $67,310 | $120,683 |
| 2016 | $1,791 | $184,308 | $65,991 | $118,317 |
| 2015 | -- | $156,764 | $47,029 | $109,735 |
| 2014 | $1,490 | $153,694 | $46,108 | $107,586 |
Source: Public Records
Map
Nearby Homes
- 12072 Alta Vista Ct
- 19235 Ridge Rd
- 12060 Lazy Ln
- 20050 Plains Dr
- 19365 MacHo Rd
- 20225 Stewart Rd
- 18920 Reeds Creek Rd
- 20285 Stewart Rd
- 0 Stewart Rd Unit 20250381
- 0 Stewart Rd Unit 20250380
- 18830 Newman Rd
- 11565 Wilder Rd
- 13185 Montecito Rd
- 20360 Acorn Ave
- 20481 Womack Rd
- 18640 Farris St
- 18595 Morris Ct
- 19605 Alta Vista Dr
- 12058 Alta Vista Ct
- 12058 Alta Vista Ct
- 12068 Alta Vista Ct
- 19628 Ridge Rd
- 19620 Ridge Rd
- 19590 Mira Loma Ct
- 19580 Mira Loma Ct
- 19618 Ridge Rd
- 19636 Ridge Rd
- 19560 Alta Vista Dr
- 12076 Alta Vista Ct
- 19535 Alta Vista Dr
- 19616 Ridge Rd
- 12079 Alta Vista Ct
- 19601 Live Oak Rd
- 12083 Alta Vista Ct
- 19540 Alta Vista Dr
- 12091 Alta Vista Ct
- 19511 Alta Vista Dr