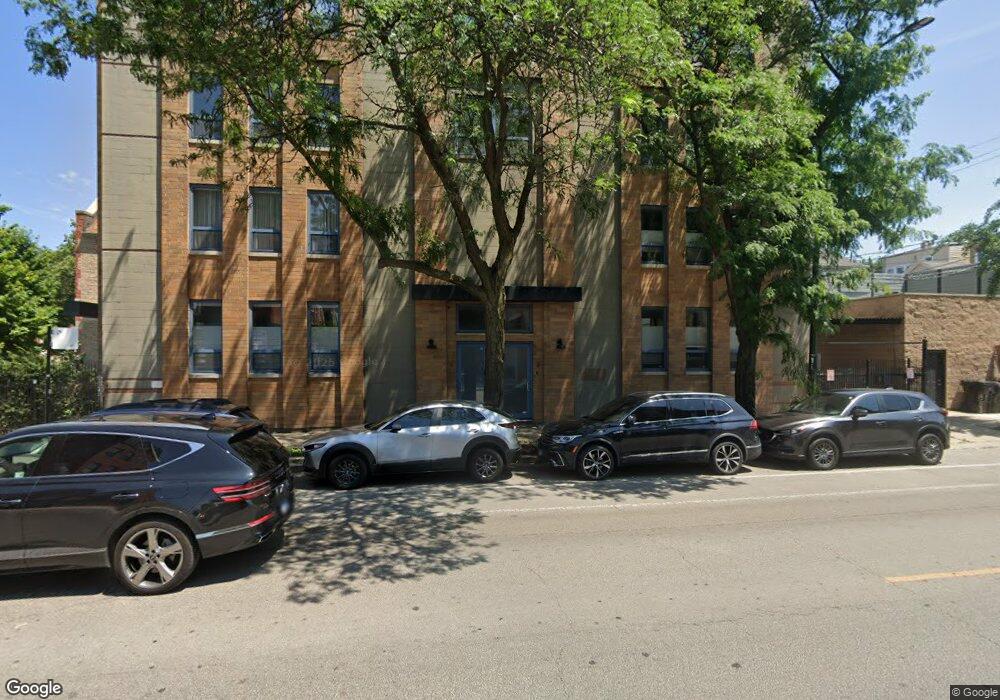
1959 W Superior St Unit 4 Chicago, IL 60622
West Town NeighborhoodEstimated Value: $574,000 - $658,000
2
Beds
2
Baths
7,600
Sq Ft
$82/Sq Ft
Est. Value
About This Home
This home is located at 1959 W Superior St Unit 4, Chicago, IL 60622 and is currently estimated at $625,560, approximately $82 per square foot. 1959 W Superior St Unit 4 is a home located in Cook County with nearby schools including Talcott Elementary School, Wells Community Academy High School, and St Nicholas Cathedral.
Ownership History
Date
Name
Owned For
Owner Type
Purchase Details
Closed on
Dec 26, 2018
Sold by
Gutierrez Liliana and Marston Kevin
Bought by
Kifiak Andrii
Current Estimated Value
Home Financials for this Owner
Home Financials are based on the most recent Mortgage that was taken out on this home.
Original Mortgage
$300,000
Outstanding Balance
$191,082
Interest Rate
4.5%
Mortgage Type
New Conventional
Estimated Equity
$434,478
Purchase Details
Closed on
Jan 10, 2005
Sold by
Gadsby Steven
Bought by
Gutierrez Liliana
Home Financials for this Owner
Home Financials are based on the most recent Mortgage that was taken out on this home.
Original Mortgage
$298,400
Interest Rate
4.87%
Mortgage Type
Unknown
Create a Home Valuation Report for This Property
The Home Valuation Report is an in-depth analysis detailing your home's value as well as a comparison with similar homes in the area
Home Values in the Area
Average Home Value in this Area
Purchase History
| Date | Buyer | Sale Price | Title Company |
|---|---|---|---|
| Kifiak Andrii | $375,000 | Old Republic Title | |
| Gutierrez Liliana | -- | Chicago Title Insurance Comp |
Source: Public Records
Mortgage History
| Date | Status | Borrower | Loan Amount |
|---|---|---|---|
| Open | Kifiak Andrii | $300,000 | |
| Previous Owner | Gutierrez Liliana | $298,400 | |
| Closed | Gutierrez Liliana | $37,300 |
Source: Public Records
Tax History Compared to Growth
Tax History
| Year | Tax Paid | Tax Assessment Tax Assessment Total Assessment is a certain percentage of the fair market value that is determined by local assessors to be the total taxable value of land and additions on the property. | Land | Improvement |
|---|---|---|---|---|
| 2024 | $9,401 | $58,957 | $5,811 | $53,146 |
| 2023 | $9,113 | $45,972 | $2,652 | $43,320 |
| 2022 | $9,113 | $45,972 | $2,652 | $43,320 |
| 2021 | $8,925 | $45,971 | $2,652 | $43,319 |
| 2020 | $9,838 | $42,114 | $2,652 | $39,462 |
| 2019 | $9,768 | $46,378 | $2,652 | $43,726 |
| 2018 | $8,908 | $46,378 | $2,652 | $43,726 |
| 2017 | $7,952 | $38,429 | $2,340 | $36,089 |
| 2016 | $7,589 | $38,429 | $2,340 | $36,089 |
| 2015 | $6,969 | $38,429 | $2,340 | $36,089 |
| 2014 | $6,189 | $33,885 | $1,989 | $31,896 |
| 2013 | $6,076 | $33,885 | $1,989 | $31,896 |
Source: Public Records
Map
Nearby Homes
- 1956 W Huron St
- 2005 W Huron St Unit 1
- 1934 W Superior St
- 1947 W Chicago Ave
- 2036 W Erie St
- 1921 W Chicago Ave
- 1609 W Superior St
- 2035 W Erie St
- 819 N Damen Ave Unit 3
- 2013 W Rice St Unit 3
- 2002 W Ohio St
- 2037 W Rice St
- 2106 W Erie St Unit 1E
- 2059 W Erie St
- 2127 W Huron St
- 2116 W Chicago Ave Unit 3W
- 2101 W Rice St Unit 402
- 1830 W Huron St Unit 2
- 2137 W Chicago Ave
- 1934 W Race Ave
- 1959 W Superior St Unit 3
- 1957 W Superior St
- 1953 W Superior St
- 1953 W Superior St
- 1951 W Superior St
- 1949 W Superior St Unit 2
- 2001 W Superior St Unit 20013E
- 2001 W Superior St Unit 20012E
- 2001 W Superior St Unit 20011E
- 2001 W Superior St Unit 2E
- 1947 W Superior St
- 2003 W Superior St Unit 1W
- 2003 W Superior St Unit 20033E
- 2003 W Superior St Unit 20031E
- 2003 W Superior St Unit 20033W
- 2003 W Superior St Unit 20032E
- 2003 W Superior St Unit 20031W
- 2003 W Superior St Unit 20032W
- 2003 W Superior St Unit 2W
- 2003 W Superior St Unit 3W