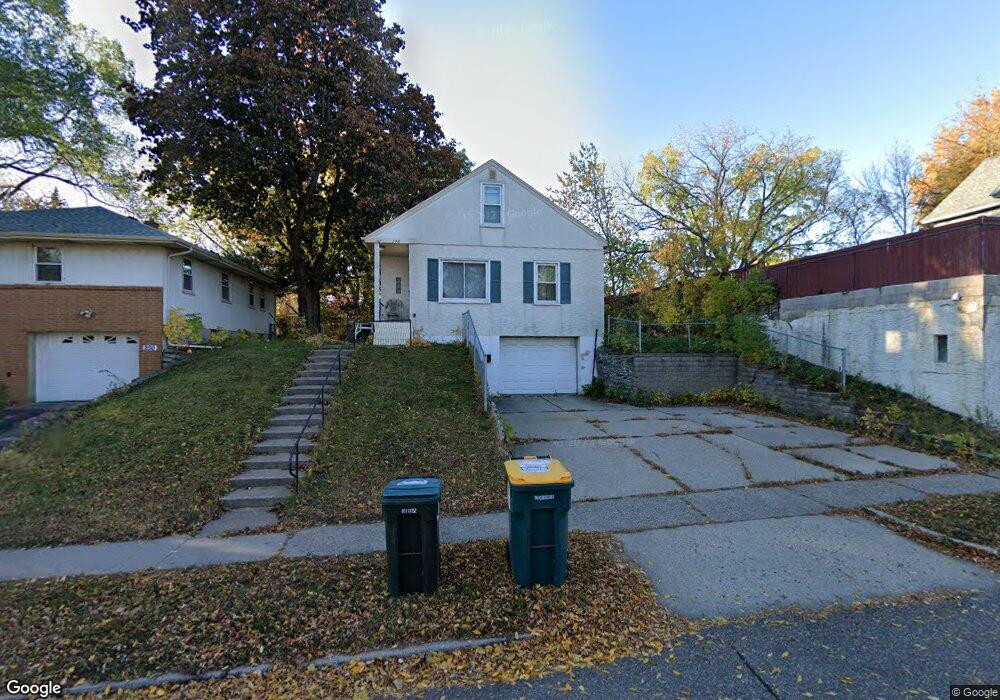
196 Butler Ave E Saint Paul, MN 55118
Estimated Value: $288,163 - $309,000
3
Beds
1
Bath
1,685
Sq Ft
$176/Sq Ft
Est. Value
About This Home
This home is located at 196 Butler Ave E, Saint Paul, MN 55118 and is currently estimated at $296,291, approximately $175 per square foot. 196 Butler Ave E is a home located in Dakota County with nearby schools including Garlough Environmental Magnet, Heritage E-STEM Magnet School, and Two Rivers High School.
Ownership History
Date
Name
Owned For
Owner Type
Purchase Details
Closed on
May 24, 2013
Sold by
Jilek Dean F and Jilek Diane
Bought by
Thelen Jessica
Current Estimated Value
Home Financials for this Owner
Home Financials are based on the most recent Mortgage that was taken out on this home.
Original Mortgage
$6,851
Outstanding Balance
$4,841
Interest Rate
3.34%
Mortgage Type
Second Mortgage Made To Cover Down Payment
Estimated Equity
$291,450
Purchase Details
Closed on
May 15, 2006
Sold by
Kautzman Michael and Kautzman Adrienne
Bought by
Jilek Dean F
Home Financials for this Owner
Home Financials are based on the most recent Mortgage that was taken out on this home.
Original Mortgage
$148,800
Interest Rate
6.68%
Mortgage Type
New Conventional
Purchase Details
Closed on
Nov 20, 2003
Sold by
Wenker Debra L
Bought by
Kautzman Michael
Create a Home Valuation Report for This Property
The Home Valuation Report is an in-depth analysis detailing your home's value as well as a comparison with similar homes in the area
Home Values in the Area
Average Home Value in this Area
Purchase History
| Date | Buyer | Sale Price | Title Company |
|---|---|---|---|
| Thelen Jessica | $142,000 | Burnet Title | |
| Jilek Dean F | $186,000 | -- | |
| Kautzman Michael | $160,000 | -- |
Source: Public Records
Mortgage History
| Date | Status | Borrower | Loan Amount |
|---|---|---|---|
| Open | Thelen Jessica | $6,851 | |
| Open | Thelen Jessica | $139,428 | |
| Previous Owner | Jilek Dean F | $148,800 |
Source: Public Records
Tax History
| Year | Tax Paid | Tax Assessment Tax Assessment Total Assessment is a certain percentage of the fair market value that is determined by local assessors to be the total taxable value of land and additions on the property. | Land | Improvement |
|---|---|---|---|---|
| 2024 | $2,958 | $248,200 | $55,000 | $193,200 |
| 2023 | $2,958 | $251,300 | $58,300 | $193,000 |
| 2022 | $2,502 | $242,700 | $58,100 | $184,600 |
| 2021 | $2,370 | $206,300 | $50,500 | $155,800 |
| 2020 | $2,240 | $195,500 | $48,100 | $147,400 |
| 2019 | $2,298 | $181,800 | $45,800 | $136,000 |
| 2018 | $2,103 | $161,500 | $42,800 | $118,700 |
| 2017 | $1,927 | $153,500 | $40,800 | $112,700 |
| 2016 | $1,978 | $136,400 | $37,100 | $99,300 |
| 2015 | $1,798 | $114,379 | $29,931 | $84,448 |
| 2014 | -- | $98,029 | $26,620 | $71,409 |
| 2013 | -- | $89,745 | $23,958 | $65,787 |
Source: Public Records
Map
Nearby Homes
- 155 Conver St
- 272 Butler Ave E
- 150 Westchester Dr
- 1251 Macarthur Ave
- 1067 Robert St S
- 1290 Livingston Ave
- 1076 Humboldt Ave
- 1116 Hall Ave
- 10 Logan Ave E
- 1294 Hall Ave
- 181 Annapolis St E
- 188 Wyoming St E
- 1297 Hall Ave
- 274 Wyoming St E
- 12 Imperial Dr W
- 1044 Winslow Ave
- 926 Stryker Ave
- 40 Winona St E
- 100 Imperial Dr W Unit 404
- 973 Bidwell St
- 200 Butler Ave E
- 188 Butler Ave E
- 205 205 Butler Ave E
- 199 Conver St
- 193 Conver St
- 182 Butler Ave E
- 1119 Oakdale Ave
- 203 Conver St
- 189 Conver St
- 199 Butler Ave E
- 205 Butler Ave E
- 209 Conver St
- 1115 Oakdale Ave
- 191 Butler Ave E
- 183 Conver St
- 178 Butler Ave E
- 185 Butler Ave E
- 215 Conver St
- 179 Conver St
- 181 Butler Ave E
Your Personal Tour Guide
Ask me questions while you tour the home.