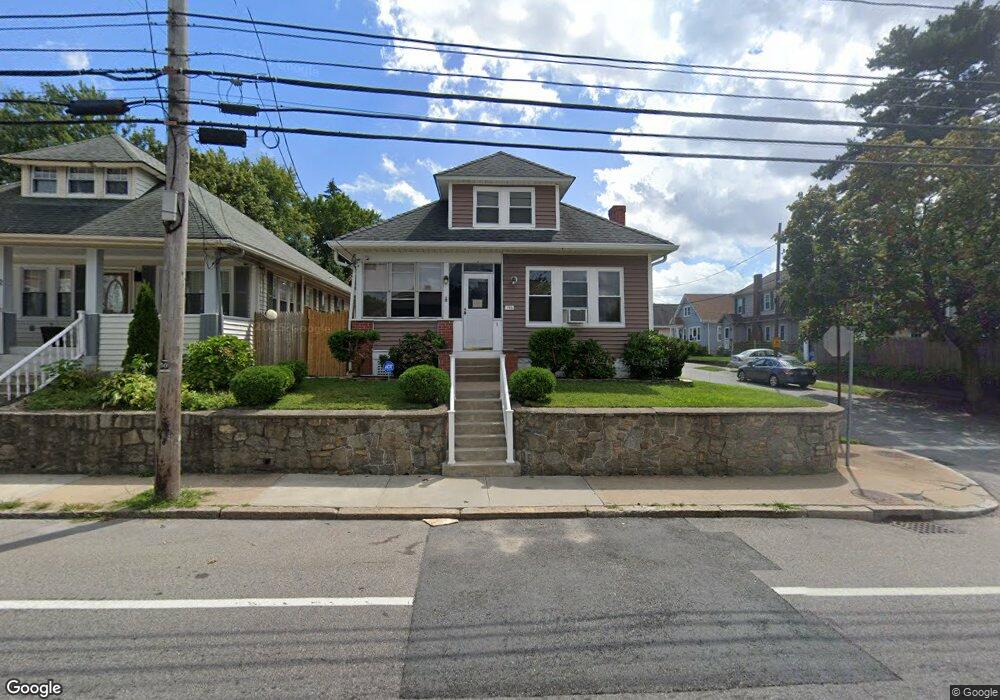
196 Park Ave Cranston, RI 02905
Edgewood NeighborhoodEstimated Value: $397,000 - $481,000
3
Beds
1
Bath
1,620
Sq Ft
$263/Sq Ft
Est. Value
About This Home
This home is located at 196 Park Ave, Cranston, RI 02905 and is currently estimated at $426,746, approximately $263 per square foot. 196 Park Ave is a home located in Providence County with nearby schools including Edgewood Highland Elementary School, Edward S. Rhodes School, and Park View Middle School.
Ownership History
Date
Name
Owned For
Owner Type
Purchase Details
Closed on
Apr 17, 2023
Sold by
Ingalla Vincent G
Bought by
Neri Walter J
Current Estimated Value
Home Financials for this Owner
Home Financials are based on the most recent Mortgage that was taken out on this home.
Original Mortgage
$300,000
Outstanding Balance
$290,491
Interest Rate
6.65%
Mortgage Type
Purchase Money Mortgage
Estimated Equity
$136,255
Purchase Details
Closed on
Feb 16, 2023
Sold by
Neri Walter J and Ingalia Vincent G
Bought by
Ingalia Vincent G
Home Financials for this Owner
Home Financials are based on the most recent Mortgage that was taken out on this home.
Original Mortgage
$300,000
Outstanding Balance
$290,491
Interest Rate
6.65%
Mortgage Type
Purchase Money Mortgage
Estimated Equity
$136,255
Create a Home Valuation Report for This Property
The Home Valuation Report is an in-depth analysis detailing your home's value as well as a comparison with similar homes in the area
Home Values in the Area
Average Home Value in this Area
Purchase History
| Date | Buyer | Sale Price | Title Company |
|---|---|---|---|
| Neri Walter J | $300,000 | None Available | |
| Ingalia Vincent G | -- | None Available |
Source: Public Records
Mortgage History
| Date | Status | Borrower | Loan Amount |
|---|---|---|---|
| Open | Neri Walter J | $300,000 |
Source: Public Records
Tax History
| Year | Tax Paid | Tax Assessment Tax Assessment Total Assessment is a certain percentage of the fair market value that is determined by local assessors to be the total taxable value of land and additions on the property. | Land | Improvement |
|---|---|---|---|---|
| 2025 | $4,604 | $331,700 | $102,900 | $228,800 |
| 2024 | $4,514 | $331,700 | $102,900 | $228,800 |
| 2023 | $4,046 | $214,100 | $45,200 | $168,900 |
| 2022 | $3,963 | $214,100 | $45,200 | $168,900 |
| 2021 | $3,854 | $214,100 | $45,200 | $168,900 |
| 2020 | $3,325 | $160,100 | $35,500 | $124,600 |
| 2019 | $3,325 | $160,100 | $35,500 | $124,600 |
| 2018 | $3,248 | $160,100 | $35,500 | $124,600 |
| 2017 | $2,397 | $104,500 | $16,100 | $88,400 |
| 2016 | $2,346 | $104,500 | $16,100 | $88,400 |
| 2015 | $2,346 | $104,500 | $16,100 | $88,400 |
| 2014 | $2,215 | $97,000 | $16,100 | $80,900 |
Source: Public Records
Map
Nearby Homes
- 27 Cliffdale Ave
- 42 Netherlands Ave
- 29 Malvern Ave
- 28 Sylvan Ave
- 10 Sylvan Ave
- 73 Western Promenade
- 63 Taft St
- 73 Moorland Ave
- 19 Warwick Ave
- 172 Bluff Ave
- 126 Columbia Ave
- 94 Holmes Rd
- 27 Vickery St
- 147 Wentworth Ave
- 1291 Narragansett Blvd Unit 4
- 210 Irving Rd
- 545 Park Ave
- 1302 Elmwood Ave
- 555 Park Ave
- 1320 Elmwood Ave
Your Personal Tour Guide
Ask me questions while you tour the home.