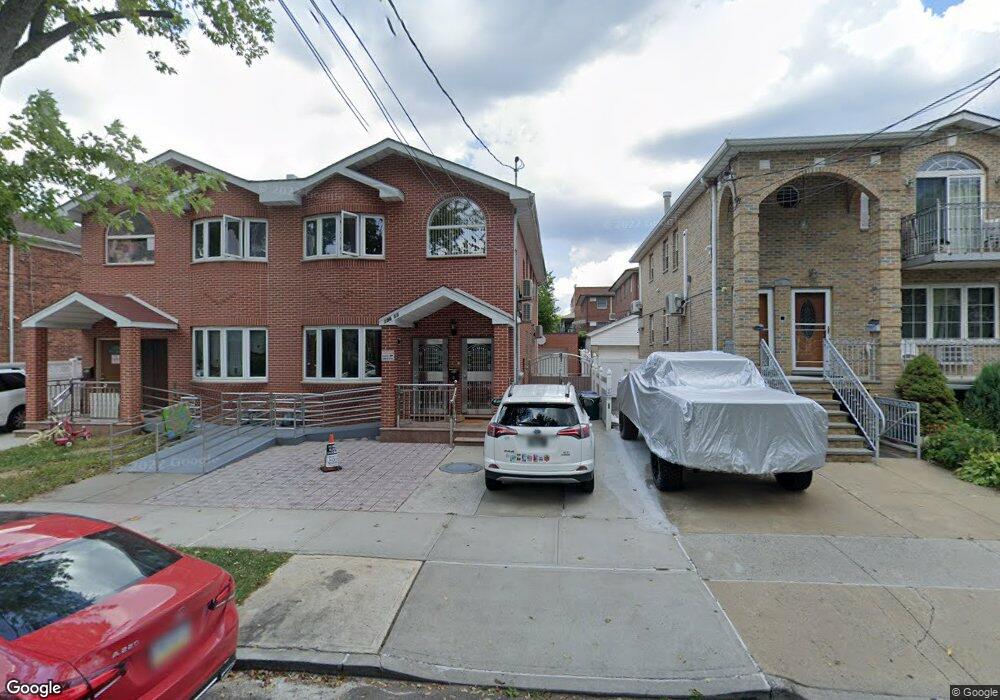
19613 42nd Ave Flushing, NY 11358
Auburndale NeighborhoodEstimated Value: $1,576,000 - $1,894,000
--
Bed
--
Bath
2,100
Sq Ft
$824/Sq Ft
Est. Value
About This Home
This home is located at 19613 42nd Ave, Flushing, NY 11358 and is currently estimated at $1,730,240, approximately $823 per square foot. 19613 42nd Ave is a home located in Queens County with nearby schools including P.S. 31 - Bayside, I.S. 25 Adrien Block, and Francis Lewis High School.
Ownership History
Date
Name
Owned For
Owner Type
Purchase Details
Closed on
Jul 26, 2016
Sold by
Realty 838 Llc
Bought by
Li Liang Qin and Yang Xiao Xin
Current Estimated Value
Home Financials for this Owner
Home Financials are based on the most recent Mortgage that was taken out on this home.
Original Mortgage
$650,000
Outstanding Balance
$519,959
Interest Rate
3.56%
Mortgage Type
Purchase Money Mortgage
Estimated Equity
$1,210,281
Purchase Details
Closed on
Apr 4, 2014
Sold by
Figueroa Living Trust and Marisol Figueroa As Trustee
Bought by
Realty 838 Llc
Purchase Details
Closed on
Oct 25, 2004
Sold by
Figueroa Marisol and Figueroa William
Bought by
Dated October 25 2004 Figueroa Living and Figueroa Marisol
Purchase Details
Closed on
Jul 22, 1998
Sold by
Bucell Leonard and Bucell Joan
Bought by
Figueroa William and Figueroa Marisol
Home Financials for this Owner
Home Financials are based on the most recent Mortgage that was taken out on this home.
Original Mortgage
$277,000
Interest Rate
6.9%
Create a Home Valuation Report for This Property
The Home Valuation Report is an in-depth analysis detailing your home's value as well as a comparison with similar homes in the area
Home Values in the Area
Average Home Value in this Area
Purchase History
| Date | Buyer | Sale Price | Title Company |
|---|---|---|---|
| Li Liang Qin | $1,180,000 | -- | |
| Li Liang Qin | $1,180,000 | -- | |
| Realty 838 Llc | $930,000 | -- | |
| Realty 838 Llc | $930,000 | -- | |
| Dated October 25 2004 Figueroa Living | -- | -- | |
| Dated October 25 2004 Figueroa Living | -- | -- | |
| Figueroa William | $312,000 | First American Title Ins Co | |
| Figueroa William | $312,000 | First American Title Ins Co |
Source: Public Records
Mortgage History
| Date | Status | Borrower | Loan Amount |
|---|---|---|---|
| Open | Li Liang Qin | $650,000 | |
| Closed | Li Liang Qin | $650,000 | |
| Previous Owner | Figueroa William | $277,000 |
Source: Public Records
Tax History Compared to Growth
Tax History
| Year | Tax Paid | Tax Assessment Tax Assessment Total Assessment is a certain percentage of the fair market value that is determined by local assessors to be the total taxable value of land and additions on the property. | Land | Improvement |
|---|---|---|---|---|
| 2025 | $13,980 | $72,101 | $20,773 | $51,328 |
| 2024 | $13,980 | $69,606 | $24,029 | $45,577 |
| 2023 | $13,559 | $67,510 | $21,012 | $46,498 |
| 2022 | $12,714 | $74,700 | $27,900 | $46,800 |
| 2021 | $12,645 | $79,920 | $27,900 | $52,020 |
| 2020 | $12,718 | $78,840 | $27,900 | $50,940 |
| 2019 | $12,134 | $86,820 | $27,900 | $58,920 |
| 2018 | $11,824 | $58,005 | $25,688 | $32,317 |
| 2017 | $11,722 | $57,505 | $22,508 | $34,997 |
| 2016 | $7,365 | $57,505 | $22,508 | $34,997 |
| 2015 | $4,651 | $26,040 | $26,040 | $0 |
| 2014 | $4,651 | $35,942 | $22,063 | $13,879 |
Source: Public Records
Map
Nearby Homes
- 196-19 42nd Rd
- 42-32 196th St
- 200-06 39th Ave
- 194-23 Station Rd
- 40-38 194th St Unit 1A
- 4048 194th St Unit A3
- 40- 41 202nd St
- 37-12 Francis Lewis Blvd
- 37-6 Francis Lewis Blvd
- 37-02 Francis Lewis Blvd
- 42-36 201st St
- 36- 40 201st St Unit A, B, C
- 40-40 203rd St Unit 12B
- 4005 203rd St
- 4320 196th St
- 43-28 196th St
- 36-05 200th St
- 204-06 42nd Ave
- 19112 Station Rd
- 42-32 204th St
- 196-13 42nd Ave Unit 2F
- 196-13 42nd Ave Unit 1F
- 19611 42nd Ave
- 19611 42nd Ave
- 19617 42nd Ave
- 19605 42nd Ave
- 19619 42nd Ave
- 196-19 42nd Ave Unit 1Fl
- 4042 Francis Lewis Blvd Unit 2nd Fl
- 4042 Francis Lewis Blvd
- 4042 Francis Lewis Blvd Unit 1st Fl
- 4043 196th St
- 4042 Francis Lewis Blvd
- 196-25 42nd Ave
- 196-11 42nd Ave
- 4040 Francis Lewis Blvd
- 4037 196th St
- 40-50 Francis Lewis Blvd
- 4050 Francis Lewis Blvd
- 19629 42nd Ave