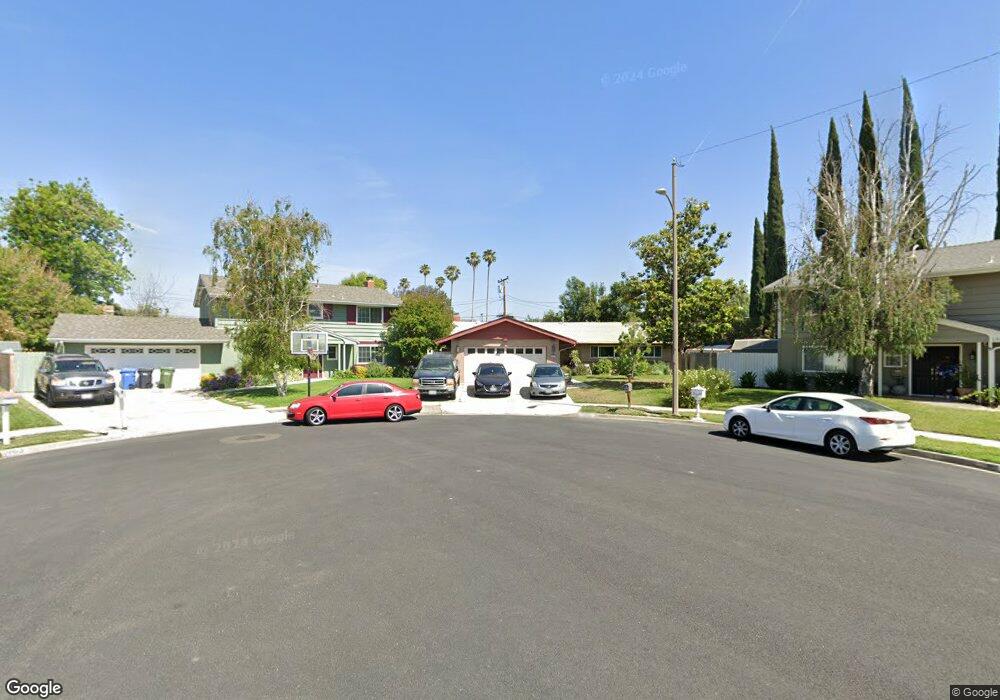
1962 Buell Ct Simi Valley, CA 93065
Central Simi Valley NeighborhoodEstimated Value: $738,000 - $806,000
4
Beds
2
Baths
1,608
Sq Ft
$479/Sq Ft
Est. Value
About This Home
This home is located at 1962 Buell Ct, Simi Valley, CA 93065 and is currently estimated at $770,176, approximately $478 per square foot. 1962 Buell Ct is a home located in Ventura County with nearby schools including Crestview Elementary School, Hillside Middle School, and Royal High School.
Ownership History
Date
Name
Owned For
Owner Type
Purchase Details
Closed on
Mar 8, 2021
Sold by
Jones Jeffrey James and Jones Marjorie
Bought by
Jones Jeffery James and Jones Marjorie
Current Estimated Value
Home Financials for this Owner
Home Financials are based on the most recent Mortgage that was taken out on this home.
Original Mortgage
$193,000
Outstanding Balance
$173,303
Interest Rate
2.8%
Mortgage Type
New Conventional
Estimated Equity
$596,873
Purchase Details
Closed on
May 21, 2016
Sold by
Jones Jeffrey J and Jones Marjorie
Bought by
The Jones Family Trust and Jones Marjorie
Purchase Details
Closed on
Nov 16, 1996
Sold by
Jones Robert N and Sheri Noethens
Bought by
Jones Robert N and Jones Sheri A
Home Financials for this Owner
Home Financials are based on the most recent Mortgage that was taken out on this home.
Original Mortgage
$35,000
Interest Rate
7.67%
Purchase Details
Closed on
Dec 1, 1993
Sold by
Standard Trust Deed Service Company
Bought by
Federal Home Loan Mortgage Corporation
Create a Home Valuation Report for This Property
The Home Valuation Report is an in-depth analysis detailing your home's value as well as a comparison with similar homes in the area
Home Values in the Area
Average Home Value in this Area
Purchase History
| Date | Buyer | Sale Price | Title Company |
|---|---|---|---|
| Jones Jeffery James | -- | Lawyers Title Company | |
| Jones Jeffery James | -- | Lawyers Title Company | |
| The Jones Family Trust | -- | None Available | |
| Jones Robert N | -- | Universal Title Co | |
| Federal Home Loan Mortgage Corporation | $160,000 | Stewart Title Co |
Source: Public Records
Mortgage History
| Date | Status | Borrower | Loan Amount |
|---|---|---|---|
| Open | Jones Jeffery James | $193,000 | |
| Closed | Jones Robert N | $35,000 |
Source: Public Records
Tax History
| Year | Tax Paid | Tax Assessment Tax Assessment Total Assessment is a certain percentage of the fair market value that is determined by local assessors to be the total taxable value of land and additions on the property. | Land | Improvement |
|---|---|---|---|---|
| 2025 | $5,685 | $460,893 | $184,354 | $276,539 |
| 2024 | $5,685 | $451,856 | $180,739 | $271,117 |
| 2023 | $5,345 | $442,997 | $177,196 | $265,801 |
| 2022 | $5,319 | $434,311 | $173,721 | $260,590 |
| 2021 | $5,276 | $425,796 | $170,315 | $255,481 |
| 2020 | $5,164 | $421,431 | $168,569 | $252,862 |
| 2019 | $4,929 | $413,168 | $165,264 | $247,904 |
| 2018 | $4,884 | $405,068 | $162,024 | $243,044 |
| 2017 | $4,773 | $397,127 | $158,848 | $238,279 |
| 2016 | $4,558 | $389,341 | $155,734 | $233,607 |
| 2015 | $4,460 | $383,495 | $153,396 | $230,099 |
| 2014 | -- | $375,986 | $150,393 | $225,593 |
Source: Public Records
Map
Nearby Homes
- 2025 Royal Ave
- 1890 Hamilton St
- 969 Roldan Ave
- 2136 Rosecrans St
- 1995 Covington Ave
- 1763 Kearney Ave
- 2044 Covington Ave
- 1147 Brandon Ave
- 2095 Morley St
- 2098 Covington Ave
- 2165 Malcolm St
- 2339 Dusan St
- 2002 Malcolm St
- 1932 Heywood St Unit B
- 1387 Cherry Ave
- 1904 Heywood St Unit L
- 896 Moffatt Cir
- 2339 Rudolph Dr
- 1755 Heywood St
- 1724 Sunnydale Ave
Your Personal Tour Guide
Ask me questions while you tour the home.