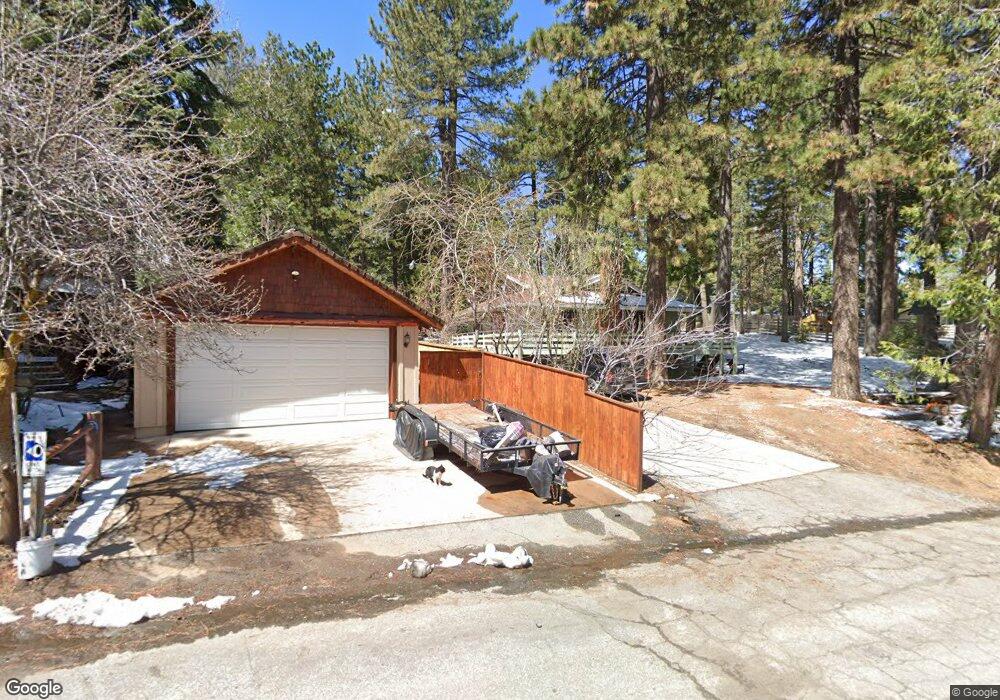
1962 Fernside Dr Running Springs, CA 92382
Estimated Value: $383,000 - $495,000
3
Beds
2
Baths
1,525
Sq Ft
$275/Sq Ft
Est. Value
About This Home
This home is located at 1962 Fernside Dr, Running Springs, CA 92382 and is currently estimated at $418,613, approximately $274 per square foot. 1962 Fernside Dr is a home located in San Bernardino County with nearby schools including Charles Hoffman Elementary School, Mary P. Henck Intermediate School, and Rim Of The World Senior High School.
Ownership History
Date
Name
Owned For
Owner Type
Purchase Details
Closed on
Jul 27, 2011
Sold by
Aurora Loan Services Llc
Bought by
Garcia Placido
Current Estimated Value
Purchase Details
Closed on
May 4, 2011
Sold by
Byars Lori Marie
Bought by
Aurora Loan Services Llc
Purchase Details
Closed on
May 20, 2004
Sold by
Houck Jamie Christopher and Houck Sarah Virginia
Bought by
Smith Keith and Smith Lori
Home Financials for this Owner
Home Financials are based on the most recent Mortgage that was taken out on this home.
Original Mortgage
$215,200
Interest Rate
6.31%
Mortgage Type
Purchase Money Mortgage
Purchase Details
Closed on
May 16, 2001
Sold by
Snow Ralph V and Snow Mary T
Bought by
Houck Jamie Christopher and Houck Sarah Virginia
Home Financials for this Owner
Home Financials are based on the most recent Mortgage that was taken out on this home.
Original Mortgage
$127,200
Interest Rate
7.1%
Create a Home Valuation Report for This Property
The Home Valuation Report is an in-depth analysis detailing your home's value as well as a comparison with similar homes in the area
Home Values in the Area
Average Home Value in this Area
Purchase History
| Date | Buyer | Sale Price | Title Company |
|---|---|---|---|
| Garcia Placido | $126,500 | Lps Default Ittle & Closing | |
| Aurora Loan Services Llc | $386,241 | Accommodation | |
| Smith Keith | $269,000 | First American | |
| Houck Jamie Christopher | $159,000 | Commonwealth Land Title Co |
Source: Public Records
Mortgage History
| Date | Status | Borrower | Loan Amount |
|---|---|---|---|
| Previous Owner | Smith Keith | $215,200 | |
| Previous Owner | Houck Jamie Christopher | $127,200 | |
| Closed | Houck Jamie Christopher | $31,800 | |
| Closed | Smith Keith | $26,800 |
Source: Public Records
Tax History Compared to Growth
Tax History
| Year | Tax Paid | Tax Assessment Tax Assessment Total Assessment is a certain percentage of the fair market value that is determined by local assessors to be the total taxable value of land and additions on the property. | Land | Improvement |
|---|---|---|---|---|
| 2025 | $2,109 | $158,388 | $31,402 | $126,986 |
| 2024 | $2,109 | $155,282 | $30,786 | $124,496 |
| 2023 | $2,086 | $152,237 | $30,182 | $122,055 |
| 2022 | $2,049 | $149,252 | $29,590 | $119,662 |
| 2021 | $2,183 | $146,326 | $29,010 | $117,316 |
| 2020 | $2,029 | $144,826 | $28,713 | $116,113 |
| 2019 | $1,982 | $141,986 | $28,150 | $113,836 |
| 2018 | $1,880 | $139,202 | $27,598 | $111,604 |
| 2017 | $1,849 | $136,473 | $27,057 | $109,416 |
| 2016 | $1,797 | $133,797 | $26,526 | $107,271 |
| 2015 | $1,780 | $131,788 | $26,128 | $105,660 |
| 2014 | $1,753 | $129,206 | $25,616 | $103,590 |
Source: Public Records
Map
Nearby Homes
- 1942 Wilderness Rd
- 31308 Firwood Dr
- 31354 Overhill Dr
- 31297 All View Dr
- 31377 Overhill Dr
- 31353 Overhill Dr
- 31466 Onacrest Dr
- 31449 Onacrest Dr
- 31306 Circle View Dr
- 31347 Circle View Dr
- 31510 Valley Ridge Dr
- 2229 Spring Oak Dr
- 2212 Spring Oak Dr
- 2236 Spring Oak Dr
- 31438 Easy St
- 2458 Spring Oak Dr
- 2402 Spring Oak Dr
- 31150 Summit Dr
- 31140 Summit Dr
- 31124 All View Dr
- 31446 Oakleaf Dr
- 31440 Oakleaf Dr
- 31430 Oakleaf Dr
- 1948 Fernside Dr
- 1938 Wilderness Rd
- 1936 Wilderness Rd
- 31418 Oakleaf Ct
- 31418 Oakleaf Dr
- 1945 Fernside Rd
- 1977 Fernside Rd
- 1940 Wilderness Rd
- 1955 Fernside Dr
- 1965 Fernside Dr
- 1989 Fernside Rd
- 1944 Wilderness Rd
- 31445 Oakleaf Dr
- 31410 Oakleaf Dr
- 1997 Fernside Dr
- 31435 Oakleaf Dr
- 1948 Wilderness Rd