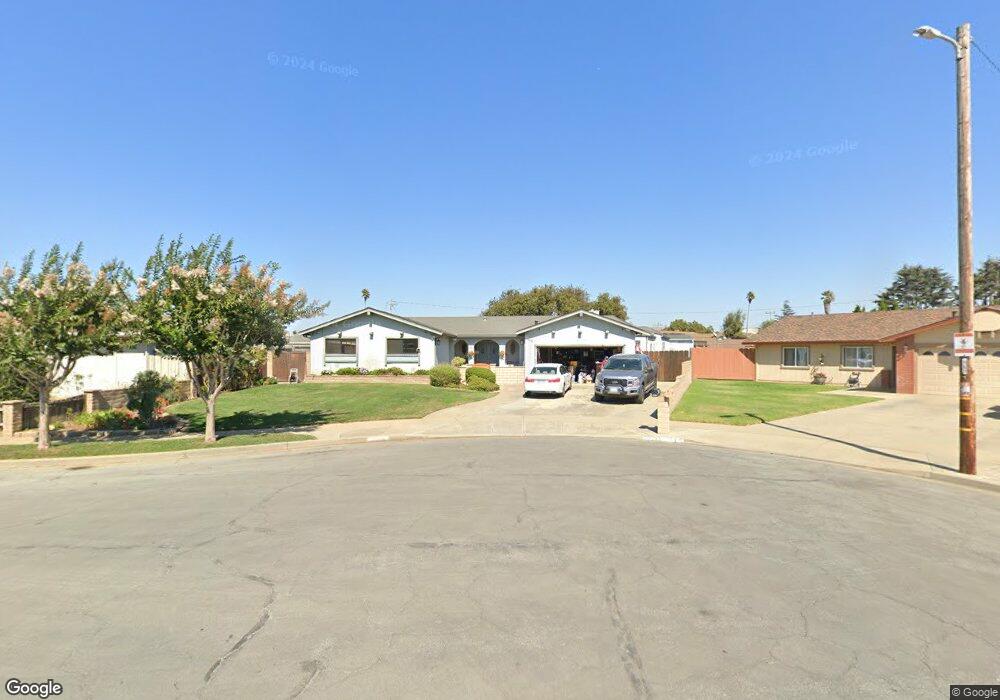
19635 Agate Cir Salinas, CA 93906
Bolsa Knolls NeighborhoodEstimated Value: $752,000 - $1,028,000
4
Beds
2
Baths
2,510
Sq Ft
$344/Sq Ft
Est. Value
About This Home
This home is located at 19635 Agate Cir, Salinas, CA 93906 and is currently estimated at $862,344, approximately $343 per square foot. 19635 Agate Cir is a home located in Monterey County with nearby schools including Everett Alvarez High School and Anthem Christian School.
Ownership History
Date
Name
Owned For
Owner Type
Purchase Details
Closed on
Feb 25, 2026
Sold by
Flores Peter
Bought by
Peter M Flores Living Trust and Flores
Current Estimated Value
Purchase Details
Closed on
Oct 26, 2001
Sold by
Flores Peter M
Bought by
Flores Peter M and Flores Rosemarie M
Home Financials for this Owner
Home Financials are based on the most recent Mortgage that was taken out on this home.
Original Mortgage
$187,500
Interest Rate
6.87%
Mortgage Type
Stand Alone First
Purchase Details
Closed on
Oct 18, 2001
Sold by
Va
Bought by
Flores Peter and Flores Rosemarie M
Home Financials for this Owner
Home Financials are based on the most recent Mortgage that was taken out on this home.
Original Mortgage
$187,500
Interest Rate
6.87%
Mortgage Type
Stand Alone First
Purchase Details
Closed on
Oct 9, 2001
Sold by
Flores Peter M and Flores Rosemarie M
Bought by
Flores Peter M
Home Financials for this Owner
Home Financials are based on the most recent Mortgage that was taken out on this home.
Original Mortgage
$187,500
Interest Rate
6.87%
Mortgage Type
Stand Alone First
Create a Home Valuation Report for This Property
The Home Valuation Report is an in-depth analysis detailing your home's value as well as a comparison with similar homes in the area
Home Values in the Area
Average Home Value in this Area
Purchase History
| Date | Buyer | Sale Price | Title Company |
|---|---|---|---|
| Peter M Flores Living Trust | -- | None Listed On Document | |
| Flores Peter M | -- | -- | |
| Flores Peter | -- | Chicago Title | |
| Flores Peter M | -- | Chicago Title Co |
Source: Public Records
Mortgage History
| Date | Status | Borrower | Loan Amount |
|---|---|---|---|
| Previous Owner | Flores Peter M | $187,500 | |
| Closed | Flores Peter M | $51,000 |
Source: Public Records
Tax History
| Year | Tax Paid | Tax Assessment Tax Assessment Total Assessment is a certain percentage of the fair market value that is determined by local assessors to be the total taxable value of land and additions on the property. | Land | Improvement |
|---|---|---|---|---|
| 2025 | $1,252 | $274,694 | $63,381 | $211,313 |
| 2024 | $1,252 | $269,309 | $62,139 | $207,170 |
| 2023 | $1,217 | $264,029 | $60,921 | $203,108 |
| 2022 | $1,292 | $258,853 | $59,727 | $199,126 |
| 2021 | $1,265 | $253,778 | $58,556 | $195,222 |
| 2020 | $1,240 | $251,177 | $57,956 | $193,221 |
| 2019 | $1,213 | $246,253 | $56,820 | $189,433 |
| 2018 | $1,268 | $241,425 | $55,706 | $185,719 |
| 2017 | $1,296 | $236,692 | $54,614 | $182,078 |
| 2016 | $1,266 | $232,052 | $53,544 | $178,508 |
| 2015 | $1,247 | $228,567 | $52,740 | $175,827 |
| 2014 | $1,184 | $224,090 | $51,707 | $172,383 |
Source: Public Records
Map
Nearby Homes
- 12782 Rogge Village Loop
- 0 San Juan Grade Rd
- 360 San Juan Grade Rd
- 12911 Barkley Dr
- 18732 Coolidge St
- 18594 Northridge Dr
- 383 Natividad Rd
- 20 Russell Rd Unit 69
- 20 Russell Rd Unit 133
- 123 Prado St
- 2408 N Main St Unit H
- 2366 N Main St Unit 8
- 1838 Lancashire Dr
- 2400 N Main St Unit F
- 55 San Juan Grade Rd Unit 79
- 55 San Juan Grade Rd Unit 18
- 55 San Juan Grade Rd Unit 63
- 1829 Delancey Dr
- 1780 Truckee Way
- 1667 Klamath Dr
- 12881 Jasper Way
- 19645 Agate Cir
- 19630 Opal Ct
- 12867 Jasper Way
- 19640 Opal Ct
- 19650 Agate Cir
- 19630 Agate Cir
- 12923 Jasper Way
- 19640 Agate Cir
- 12924 Jade Dr
- 12938 Jade Dr
- 12910 Jade Dr
- 12888 Jasper Way
- 19650 Opal Ct
- 12902 Jasper Way
- 12874 Jasper Way
- 12952 Jade Dr
- 12896 Jade Dr
- 12916 Jasper Way
- 12860 Jasper Way
Your Personal Tour Guide
Ask me questions while you tour the home.