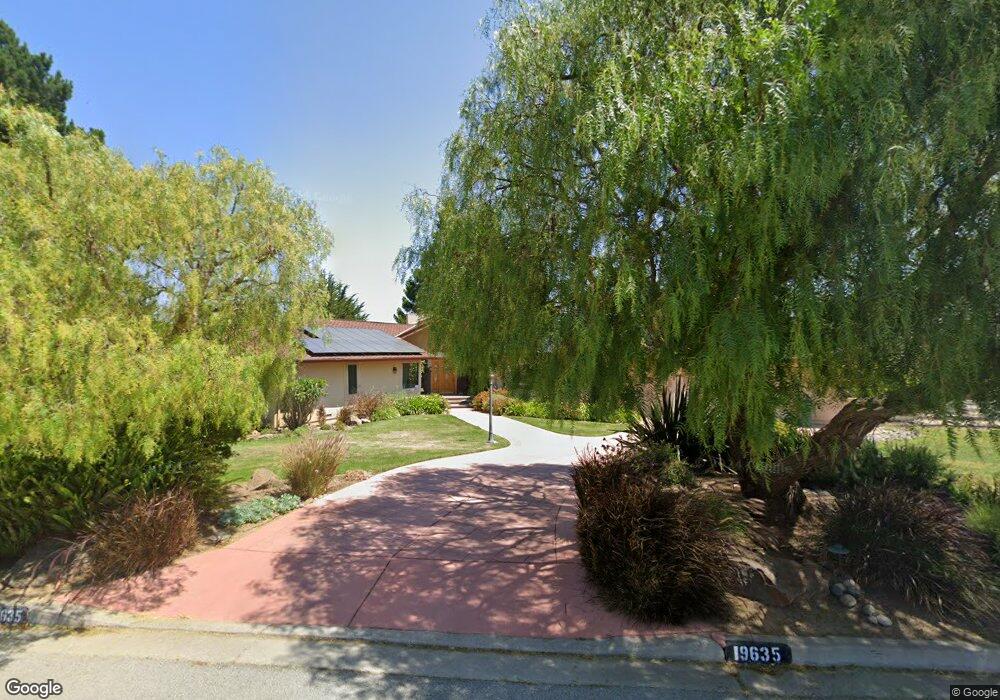
19635 Redding Dr Salinas, CA 93908
River Road NeighborhoodEstimated Value: $1,107,592 - $1,693,000
3
Beds
3
Baths
2,321
Sq Ft
$578/Sq Ft
Est. Value
About This Home
This home is located at 19635 Redding Dr, Salinas, CA 93908 and is currently estimated at $1,340,648, approximately $577 per square foot. 19635 Redding Dr is a home located in Monterey County with nearby schools including Spreckels Elementary School, Buena Vista Middle School, and Salinas High School.
Ownership History
Date
Name
Owned For
Owner Type
Purchase Details
Closed on
May 31, 2011
Sold by
Elizondo Fernando R and Trinity Susan M
Bought by
Elizondo Fernando R and Trinity Susan
Current Estimated Value
Purchase Details
Closed on
Apr 11, 1997
Sold by
Handley Katherine A
Bought by
Larsen Roger Douglas
Home Financials for this Owner
Home Financials are based on the most recent Mortgage that was taken out on this home.
Original Mortgage
$296,000
Outstanding Balance
$37,502
Interest Rate
7.66%
Estimated Equity
$1,303,146
Purchase Details
Closed on
Apr 1, 1997
Sold by
Larson Roger D
Bought by
Elizondo Fernando R and Trinity Susan M
Home Financials for this Owner
Home Financials are based on the most recent Mortgage that was taken out on this home.
Original Mortgage
$296,000
Outstanding Balance
$37,502
Interest Rate
7.66%
Estimated Equity
$1,303,146
Purchase Details
Closed on
Oct 10, 1996
Sold by
Machutes Joseph A and Machutes Constance S
Bought by
Why Be Sad Corp
Create a Home Valuation Report for This Property
The Home Valuation Report is an in-depth analysis detailing your home's value as well as a comparison with similar homes in the area
Home Values in the Area
Average Home Value in this Area
Purchase History
| Date | Buyer | Sale Price | Title Company |
|---|---|---|---|
| Elizondo Fernando R | -- | None Available | |
| Larsen Roger Douglas | $227,000 | First American Title Co | |
| Elizondo Fernando R | $386,000 | First American Title Co | |
| Why Be Sad Corp | -- | Fidelity National Title Co |
Source: Public Records
Mortgage History
| Date | Status | Borrower | Loan Amount |
|---|---|---|---|
| Open | Elizondo Fernando R | $296,000 |
Source: Public Records
Tax History
| Year | Tax Paid | Tax Assessment Tax Assessment Total Assessment is a certain percentage of the fair market value that is determined by local assessors to be the total taxable value of land and additions on the property. | Land | Improvement |
|---|---|---|---|---|
| 2025 | $6,937 | $628,638 | $244,286 | $384,352 |
| 2024 | $6,937 | $616,313 | $239,497 | $376,816 |
| 2023 | $6,688 | $604,229 | $234,801 | $369,428 |
| 2022 | $6,723 | $592,383 | $230,198 | $362,185 |
| 2021 | $6,428 | $580,769 | $225,685 | $355,084 |
| 2020 | $6,278 | $574,815 | $223,371 | $351,444 |
| 2019 | $6,241 | $563,545 | $218,992 | $344,553 |
| 2018 | $6,154 | $552,497 | $214,699 | $337,798 |
| 2017 | $6,291 | $541,665 | $210,490 | $331,175 |
| 2016 | $6,064 | $531,045 | $206,363 | $324,682 |
| 2015 | $6,086 | $523,069 | $203,264 | $319,805 |
| 2014 | $5,779 | $512,824 | $199,283 | $313,541 |
Source: Public Records
Map
Nearby Homes
- 300 Mesa Rd
- 310 Mesa Rd
- 22125 Ranchito Dr
- 228 Pine Canyon Rd
- 18595 Ranchito Del Rio Dr
- 25215 Azalea Ct
- 18050 Stonehaven
- 26419 Honor Ln
- 27312 Bavella Way
- 89 Hatton Ave
- 17669 River Run Rd
- 0000 Woodridge Ct
- 350 San Benancio Rd
- 26470 Tierra Vista Ln
- 20091 Portola Dr
- 19311 Creekside Cir Unit 36
- 22700 Picador Dr
- 90 Harper Canyon Rd
- 463 Eckhardt Rd
- 22241 Toro Hills Dr
- 19645 Redding Dr
- 19640 Redding Dr
- 19630 Redding Dr
- 19655 Redding Dr
- 23415 Redding Cir
- 23400 Redding Cir
- 19615 Redding Dr
- 19665 Redding Dr
- 19620 Redding Dr
- 23435 Redding Cir
- 19660 Redding Dr
- 23410 Redding Cir
- 23425 Redding Cir
- 19605 Redding Dr
- 23480 Pine Canyon Rd
- 23445 Redding Cir
- 19610 Redding Dr
- 23455 Redding Cir
- 23548 Belmont Cir
- 19590 Redding Dr
Your Personal Tour Guide
Ask me questions while you tour the home.