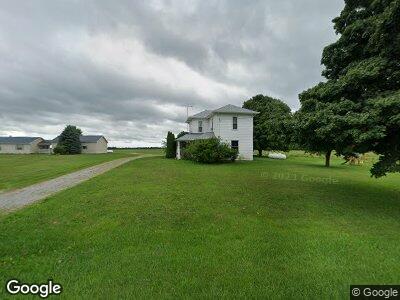
19639 State Route 47 Raymond, OH 43067
Estimated Value: $298,000 - $493,741
3
Beds
1
Bath
1,828
Sq Ft
$206/Sq Ft
Est. Value
About This Home
This home is located at 19639 State Route 47, Raymond, OH 43067 and is currently estimated at $376,914, approximately $206 per square foot. 19639 State Route 47 is a home located in Union County with nearby schools including North Union Elementary School, North Union Middle School, and North Union High School.
Ownership History
Date
Name
Owned For
Owner Type
Purchase Details
Closed on
Jun 17, 2021
Sold by
Alex Kemp Noah and Kemp Noah Alex
Bought by
Noah A Kemp Family Trust and Noah A Kemp Family Trust
Current Estimated Value
Purchase Details
Closed on
Apr 27, 2016
Sold by
Strausbaugh Lillie Kay
Bought by
Kemp And Sons Farms Llc
Home Financials for this Owner
Home Financials are based on the most recent Mortgage that was taken out on this home.
Original Mortgage
$191,250
Interest Rate
2.98%
Mortgage Type
Purchase Money Mortgage
Purchase Details
Closed on
Apr 8, 2016
Sold by
Strausbaugh Lillie Kay
Bought by
Kemp Noah A
Home Financials for this Owner
Home Financials are based on the most recent Mortgage that was taken out on this home.
Original Mortgage
$191,250
Interest Rate
2.98%
Mortgage Type
Purchase Money Mortgage
Create a Home Valuation Report for This Property
The Home Valuation Report is an in-depth analysis detailing your home's value as well as a comparison with similar homes in the area
Home Values in the Area
Average Home Value in this Area
Purchase History
| Date | Buyer | Sale Price | Title Company |
|---|---|---|---|
| Noah A Kemp Family Trust | -- | Evans Evans & Hoffman Llp | |
| Kemp And Sons Farms Llc | -- | Attorney | |
| Kemp Noah A | -- | Attorney |
Source: Public Records
Mortgage History
| Date | Status | Borrower | Loan Amount |
|---|---|---|---|
| Previous Owner | Kemp And Sons Farms Llc | $191,250 |
Source: Public Records
Tax History Compared to Growth
Tax History
| Year | Tax Paid | Tax Assessment Tax Assessment Total Assessment is a certain percentage of the fair market value that is determined by local assessors to be the total taxable value of land and additions on the property. | Land | Improvement |
|---|---|---|---|---|
| 2024 | $3,061 | $69,110 | $30,130 | $38,980 |
| 2023 | $3,061 | $69,110 | $30,130 | $38,980 |
| 2022 | $3,018 | $69,110 | $30,130 | $38,980 |
| 2021 | $2,578 | $105,970 | $78,090 | $27,880 |
| 2020 | $2,348 | $105,970 | $78,090 | $27,880 |
| 2019 | $2,362 | $105,970 | $78,090 | $27,880 |
| 2018 | $2,432 | $89,970 | $70,050 | $19,920 |
| 2017 | $2,419 | $89,970 | $70,050 | $19,920 |
| 2016 | $2,450 | $89,970 | $70,050 | $19,920 |
| 2015 | $2,452 | $108,280 | $95,220 | $13,060 |
| 2014 | $2,361 | $108,280 | $95,220 | $13,060 |
| 2013 | $2,398 | $108,280 | $95,220 | $13,060 |
Source: Public Records
Map
Nearby Homes
- 28249 State Route 739
- 28424 Ohio 31
- 25875 Ohio 31
- 19015 Powderlick Rd
- 21100 Fleckinger Rd
- 17920 Miller Rd
- 16930 Webb Rd
- 30736 State Route 31
- 0 Yearsley Rd
- 20543 Treaty Line Rd
- 25437 Patrick Brush Run Rd
- 19809 State Route 739
- 0 Powder Lick Rd Unit 1016484
- 29040 Mcmillen Rd
- 23863 Drake Skidmore Rd
- 25947 Lunda Rd
- 21743 Ohio 347
- 26180 Newton-Perkins Rd
- 17275 State Route 739
- 15301 Gandy Eddy Rd
- 19639 State Route 47
- 19462 State Route 47
- 0 State Route 47 Unit 213025303
- 0 State Route 47 Unit 213025305
- 0 State Route 47 Unit 1021655
- 0 State Route 47 Unit 222037567
- 19991 Ohio 47
- 19991 State Route 47
- 000 State Route 31
- 28180 Bitler Rd
- 27898 Fawley Rd
- 19132 Ohio 47
- 19132 State Route 47
- 28736 Storms Rd
- 28918 Storms Rd
- 20220 State Route 47
- 20221 State Route 47
- 28384 Bitler Rd
- 28654 Storms Rd
- 43064 Storms Rd