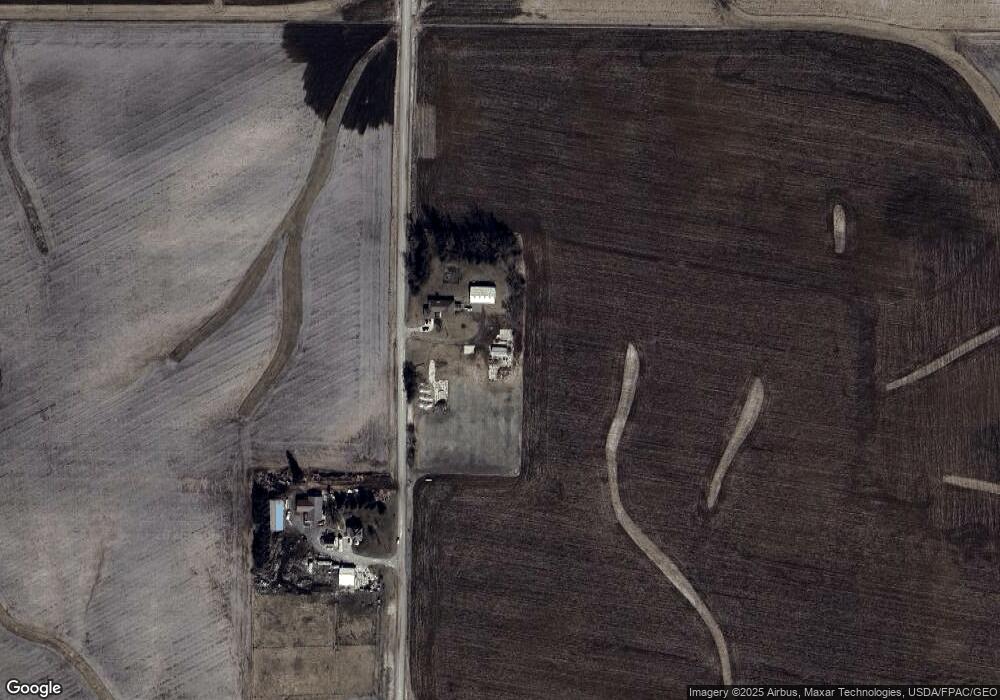
1964 R Ave South Amana, IA 52334
Estimated Value: $358,000 - $488,000
4
Beds
5
Baths
2,318
Sq Ft
$178/Sq Ft
Est. Value
About This Home
This home is located at 1964 R Ave, South Amana, IA 52334 and is currently estimated at $413,688, approximately $178 per square foot. 1964 R Ave is a home located in Iowa County with nearby schools including Mary Welsh Elementary School and Williamsburg Junior/Senior High School.
Ownership History
Date
Name
Owned For
Owner Type
Purchase Details
Closed on
Sep 6, 2024
Sold by
Jones David N and Jones Kathleen K
Bought by
David N Jones Revocable Trust and Jones
Current Estimated Value
Purchase Details
Closed on
Dec 28, 2021
Sold by
Stanerson Richard H and Stanerson Judith Ann
Bought by
Wardenburg Zachary Martin and Wardenburg Allison K
Home Financials for this Owner
Home Financials are based on the most recent Mortgage that was taken out on this home.
Original Mortgage
$315,933
Interest Rate
3.11%
Mortgage Type
FHA
Create a Home Valuation Report for This Property
The Home Valuation Report is an in-depth analysis detailing your home's value as well as a comparison with similar homes in the area
Home Values in the Area
Average Home Value in this Area
Purchase History
| Date | Buyer | Sale Price | Title Company |
|---|---|---|---|
| David N Jones Revocable Trust | -- | None Listed On Document | |
| Wardenburg Zachary Martin | $345,000 | None Available |
Source: Public Records
Mortgage History
| Date | Status | Borrower | Loan Amount |
|---|---|---|---|
| Previous Owner | Wardenburg Zachary Martin | $315,933 |
Source: Public Records
Tax History Compared to Growth
Tax History
| Year | Tax Paid | Tax Assessment Tax Assessment Total Assessment is a certain percentage of the fair market value that is determined by local assessors to be the total taxable value of land and additions on the property. | Land | Improvement |
|---|---|---|---|---|
| 2024 | $4,302 | $350,070 | $61,830 | $288,240 |
| 2023 | $4,324 | $350,070 | $61,830 | $288,240 |
| 2022 | $4,110 | $302,870 | $55,780 | $247,090 |
| 2021 | $3,940 | $302,870 | $55,780 | $247,090 |
| 2020 | $3,858 | $273,250 | $55,780 | $217,470 |
| 2019 | $3,820 | $273,250 | $55,780 | $217,470 |
| 2018 | $3,678 | $259,940 | $50,710 | $209,230 |
| 2017 | $3,760 | $259,940 | $50,710 | $209,230 |
| 2016 | $3,732 | $262,130 | $50,710 | $211,420 |
| 2015 | $3,732 | $262,130 | $50,710 | $211,420 |
| 2014 | $3,718 | $254,650 | $50,710 | $203,940 |
Source: Public Records
Map
Nearby Homes
