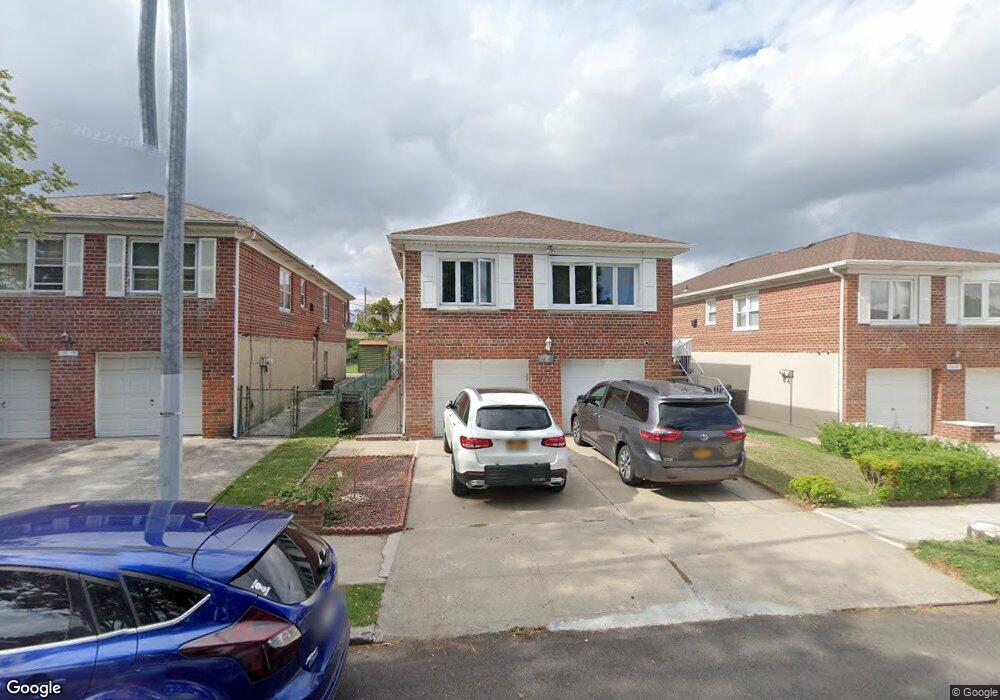
19645 45th Dr Flushing, NY 11358
Auburndale NeighborhoodEstimated Value: $1,239,000 - $1,473,733
Studio
--
Bath
1,932
Sq Ft
$702/Sq Ft
Est. Value
About This Home
This home is located at 19645 45th Dr, Flushing, NY 11358 and is currently estimated at $1,356,683, approximately $702 per square foot. 19645 45th Dr is a home located in Queens County with nearby schools including P.S. 162 The John Golden School, M.S. 158 - Marie Curie, and Francis Lewis High School.
Ownership History
Date
Name
Owned For
Owner Type
Purchase Details
Closed on
Mar 31, 2021
Sold by
Jeon Christine
Bought by
Fang Min Min and Luo Guo Wang
Current Estimated Value
Home Financials for this Owner
Home Financials are based on the most recent Mortgage that was taken out on this home.
Original Mortgage
$548,000
Outstanding Balance
$495,174
Interest Rate
3.05%
Mortgage Type
Purchase Money Mortgage
Estimated Equity
$861,509
Purchase Details
Closed on
Oct 15, 2014
Sold by
Xiao Yue and Zhu Lei
Bought by
Jeon Christine
Purchase Details
Closed on
Apr 25, 2013
Sold by
Living Trust Of Anthony J Oliva In
Bought by
Xiao Yue and Zhu Lei
Purchase Details
Closed on
Jun 3, 2009
Sold by
Oliva Anthony J and Oliva Eleanor N
Bought by
Living Trust Of Anthony J Oliva and Living Trust Of Eleanor N Olivia
Create a Home Valuation Report for This Property
The Home Valuation Report is an in-depth analysis detailing your home's value as well as a comparison with similar homes in the area
Home Values in the Area
Average Home Value in this Area
Purchase History
| Date | Buyer | Sale Price | Title Company |
|---|---|---|---|
| Fang Min Min | $1,150,000 | -- | |
| Jeon Christine | $900,000 | -- | |
| Xiao Yue | $775,000 | -- | |
| Living Trust Of Anthony J Oliva | -- | -- |
Source: Public Records
Mortgage History
| Date | Status | Borrower | Loan Amount |
|---|---|---|---|
| Open | Fang Min Min | $548,000 |
Source: Public Records
Tax History
| Year | Tax Paid | Tax Assessment Tax Assessment Total Assessment is a certain percentage of the fair market value that is determined by local assessors to be the total taxable value of land and additions on the property. | Land | Improvement |
|---|---|---|---|---|
| 2025 | $11,395 | $56,734 | $16,091 | $40,643 |
| 2024 | $11,395 | $56,732 | $17,839 | $38,893 |
| 2023 | $11,308 | $56,302 | $17,301 | $39,001 |
| 2022 | $10,604 | $66,960 | $24,300 | $42,660 |
| 2021 | $10,546 | $63,300 | $21,540 | $41,760 |
| 2020 | $10,007 | $65,880 | $21,540 | $44,340 |
| 2019 | $9,890 | $72,540 | $21,540 | $51,000 |
| 2018 | $9,564 | $46,918 | $14,932 | $31,986 |
| 2017 | $9,023 | $44,265 | $14,907 | $29,358 |
| 2016 | $8,348 | $44,265 | $14,907 | $29,358 |
| 2015 | $4,695 | $39,398 | $18,494 | $20,904 |
| 2014 | $4,695 | $39,398 | $20,468 | $18,930 |
Source: Public Records
Map
Nearby Homes
- 196-64 45th Ave
- 45-66 196th Place
- 4552 196th St
- 45-31 195th St
- 200-38 45th Ave
- 43-44 195th St
- 4604 195th St
- 42-36 201st St
- 47-02 Francis Lewis Blvd
- 199-04 47th Ave
- 45-47 193rd St
- 4539 192nd St
- 4756 196th St
- 47-55 194th St
- 47-49 194th St
- 20206 Rocky Hill Rd Unit C1
- 40-41 202nd St
- 204-19 46th Rd
- 4048 194th St Unit A3
- 4032 195th St
- 19649 45th Dr
- 19639 45th Dr
- 196-45 45th Dr
- 19653 45th Dr
- 19640 45th Rd
- 4535 196th Place
- 4531 196th Place
- 4529 196th Place
- 196-40 45th Rd
- 4539 196th Place
- 19657 45th Dr
- 196-57 45th Dr
- 4527 196th Place
- 19652 45th Rd
- 4543 196th Place
- 45-43 196th Place
- 21-17 196 Place
- 19661 45th Dr
- 19656 45th Rd
- 196-44 45th Dr Unit 1 Fl
Your Personal Tour Guide
Ask me questions while you tour the home.