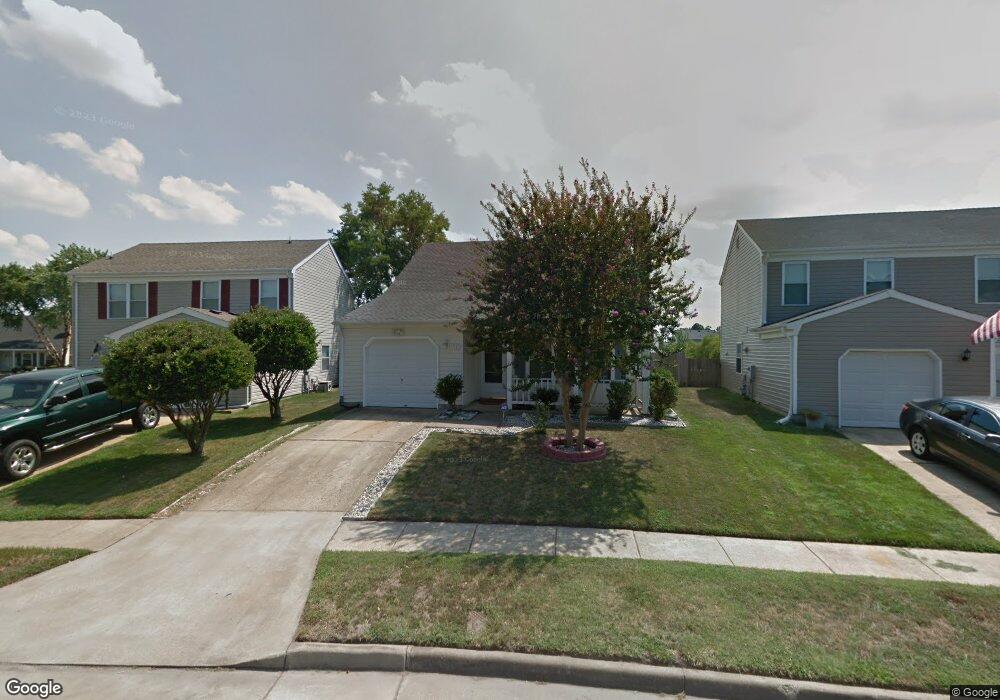
1968 Rock Lake Loop Virginia Beach, VA 23456
Landstown NeighborhoodEstimated Value: $392,000 - $422,000
3
Beds
3
Baths
1,762
Sq Ft
$233/Sq Ft
Est. Value
About This Home
This home is located at 1968 Rock Lake Loop, Virginia Beach, VA 23456 and is currently estimated at $410,261, approximately $232 per square foot. 1968 Rock Lake Loop is a home located in Virginia Beach City with nearby schools including Landstown Elementary School, Landstown Middle School, and Landstown High School.
Ownership History
Date
Name
Owned For
Owner Type
Purchase Details
Closed on
Jul 10, 2009
Sold by
Harrell Mark E
Bought by
Wang Wei
Current Estimated Value
Home Financials for this Owner
Home Financials are based on the most recent Mortgage that was taken out on this home.
Original Mortgage
$188,800
Outstanding Balance
$123,223
Interest Rate
5.31%
Mortgage Type
New Conventional
Estimated Equity
$287,038
Purchase Details
Closed on
Apr 16, 2003
Sold by
Kinney James F
Bought by
Harrell Mark E
Home Financials for this Owner
Home Financials are based on the most recent Mortgage that was taken out on this home.
Original Mortgage
$137,887
Interest Rate
5.75%
Mortgage Type
VA
Purchase Details
Closed on
Mar 22, 1999
Sold by
Rosenberg Frank J
Bought by
Kinney James F
Home Financials for this Owner
Home Financials are based on the most recent Mortgage that was taken out on this home.
Original Mortgage
$117,317
Interest Rate
6.78%
Create a Home Valuation Report for This Property
The Home Valuation Report is an in-depth analysis detailing your home's value as well as a comparison with similar homes in the area
Home Values in the Area
Average Home Value in this Area
Purchase History
| Date | Buyer | Sale Price | Title Company |
|---|---|---|---|
| Wang Wei | $236,000 | -- | |
| Harrell Mark E | $143,000 | -- | |
| Kinney James F | $113,900 | -- |
Source: Public Records
Mortgage History
| Date | Status | Borrower | Loan Amount |
|---|---|---|---|
| Open | Wang Wei | $188,800 | |
| Previous Owner | Harrell Mark E | $137,887 | |
| Previous Owner | Kinney James F | $117,317 |
Source: Public Records
Tax History Compared to Growth
Tax History
| Year | Tax Paid | Tax Assessment Tax Assessment Total Assessment is a certain percentage of the fair market value that is determined by local assessors to be the total taxable value of land and additions on the property. | Land | Improvement |
|---|---|---|---|---|
| 2025 | $3,470 | $366,800 | $134,000 | $232,800 |
| 2024 | $3,470 | $357,700 | $119,000 | $238,700 |
| 2023 | $3,477 | $351,200 | $111,000 | $240,200 |
| 2022 | $3,042 | $307,300 | $103,000 | $204,300 |
| 2021 | $2,692 | $271,900 | $91,000 | $180,900 |
| 2020 | $2,551 | $250,700 | $91,000 | $159,700 |
| 2019 | $2,525 | $243,200 | $90,000 | $153,200 |
| 2018 | $2,438 | $243,200 | $90,000 | $153,200 |
| 2017 | $2,319 | $231,300 | $90,000 | $141,300 |
| 2016 | $2,257 | $228,000 | $90,000 | $138,000 |
| 2015 | $2,230 | $225,300 | $90,000 | $135,300 |
| 2014 | $1,954 | $213,100 | $96,000 | $117,100 |
Source: Public Records
Map
Nearby Homes
- 2224 Rock Lake Loop
- 2260 Rock Lake Loop
- 1980 Aquamarine Dr
- 3900 Dupree Ln
- 1845 Rock Lake Loop
- 3868 Shooting Star Dr
- 3950 Lantana Place
- The Addison Plan at Guilford at Spence Crossing
- The Rowen Plan at Guilford at Spence Crossing
- 3829 Lasalle Dr Unit 107
- 3852 Lasalle Dr Unit 101
- 4165 Laurel Green Cir
- 1720 Vankar Dr Unit 308
- 1720 Vankar Dr Unit 207
- 1720 Vankar Dr Unit 302
- 1720 Vankar Dr
- 1964 Rock Lake Loop
- 1972 Rock Lake Loop
- 1805 Rapids Ct
- 1704 Rippling Rock Ct
- 1700 Rippling Rock Ct
- 1809 Rapids Ct
- 1708 Rippling Rock Ct
- 1965 Rock Lake Loop
- 1969 Rock Lake Loop
- 2001 Rippling Rock Dr
- 1813 Rapids Ct
- 1800 Rapids Ct
- 1712 Rippling Rock Ct
- 1804 Rapids Ct
- 1816 Rapids Ct
- 1981 Rock Lake Loop
- MM Regina W Frog
- MM the Lakeshore
- MM Caleb -Highland Parish
- 2009 Rippling Rock Dr