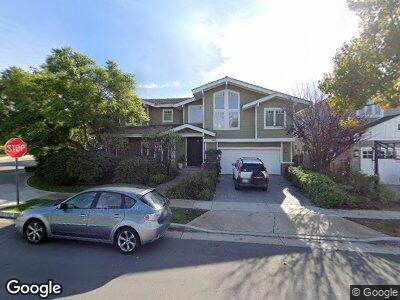
1969 Port Weybridge Place Newport Beach, CA 92660
Harbor View Homes NeighborhoodEstimated Value: $4,534,000 - $5,635,000
5
Beds
5
Baths
4,011
Sq Ft
$1,228/Sq Ft
Est. Value
About This Home
This home is located at 1969 Port Weybridge Place, Newport Beach, CA 92660 and is currently estimated at $4,924,177, approximately $1,227 per square foot. 1969 Port Weybridge Place is a home located in Orange County with nearby schools including Roy O. Andersen Elementary School, Corona del Mar Middle and High School, and Newport Christian School.
Ownership History
Date
Name
Owned For
Owner Type
Purchase Details
Closed on
Jul 23, 2002
Sold by
Carrier Karl J and Carrier Martha B
Bought by
Carrier Karl J and Carrier Martha L B
Current Estimated Value
Home Financials for this Owner
Home Financials are based on the most recent Mortgage that was taken out on this home.
Original Mortgage
$750,000
Interest Rate
6.6%
Purchase Details
Closed on
Jun 5, 2002
Sold by
Huth James and Raze Susan
Bought by
Carrier Karl J and Carrier Martha L B
Home Financials for this Owner
Home Financials are based on the most recent Mortgage that was taken out on this home.
Original Mortgage
$750,000
Interest Rate
6.6%
Purchase Details
Closed on
Jul 29, 1998
Sold by
Weir William P and Weir Susan H
Bought by
Huth James and Raze Susan
Home Financials for this Owner
Home Financials are based on the most recent Mortgage that was taken out on this home.
Original Mortgage
$636,000
Interest Rate
6.95%
Create a Home Valuation Report for This Property
The Home Valuation Report is an in-depth analysis detailing your home's value as well as a comparison with similar homes in the area
Home Values in the Area
Average Home Value in this Area
Purchase History
| Date | Buyer | Sale Price | Title Company |
|---|---|---|---|
| Carrier Karl J | -- | -- | |
| Carrier Karl J | $1,000,000 | California Title Company | |
| Huth James | $795,000 | Old Republic Title Company |
Source: Public Records
Mortgage History
| Date | Status | Borrower | Loan Amount |
|---|---|---|---|
| Open | Carrier Karl J | $500,000 | |
| Closed | Carrier Karl J | $250,000 | |
| Open | Carrier Karl J | $1,031,250 | |
| Previous Owner | Carrier Karl J | $750,000 | |
| Previous Owner | Huth James | $636,000 |
Source: Public Records
Tax History Compared to Growth
Tax History
| Year | Tax Paid | Tax Assessment Tax Assessment Total Assessment is a certain percentage of the fair market value that is determined by local assessors to be the total taxable value of land and additions on the property. | Land | Improvement |
|---|---|---|---|---|
| 2024 | $17,063 | $1,584,246 | $1,242,950 | $341,296 |
| 2023 | $16,662 | $1,553,183 | $1,218,579 | $334,604 |
| 2022 | $16,384 | $1,522,729 | $1,194,685 | $328,044 |
| 2021 | $16,071 | $1,492,872 | $1,171,260 | $321,612 |
| 2020 | $15,917 | $1,477,565 | $1,159,250 | $318,315 |
| 2019 | $15,590 | $1,448,594 | $1,136,520 | $312,074 |
| 2018 | $15,280 | $1,420,191 | $1,114,236 | $305,955 |
| 2017 | $15,010 | $1,392,345 | $1,092,389 | $299,956 |
| 2016 | $14,674 | $1,365,045 | $1,070,970 | $294,075 |
| 2015 | $14,535 | $1,344,541 | $1,054,883 | $289,658 |
| 2014 | $14,193 | $1,318,204 | $1,034,220 | $283,984 |
Source: Public Records
Map
Nearby Homes
- 2007 Port Provence Place
- 1977 Port Cardiff Place
- 17 Monaco
- 9 Saint Tropez
- 1981 Port Dunleigh Cir
- 1730 Port Abbey Place
- 31 Saint Tropez
- 1736 Port Sheffield Place
- 1991 Port Claridge Place
- 1954 Port Locksleigh Place
- 1830 Port Wheeler Place
- 1963 Port Edward Place
- 32 Bargemon
- 11 Montpellier Unit 22
- 2023 Yacht Defender
- 1830 Port Renwick Place
- 2011 Yacht Vindex
- 15 Cavaillon
- 505 Bay Hill Dr
- 2005 Yacht Resolute
- 1969 Port Weybridge Place
- 1963 Port Weybridge Place
- 1970 Port Provence Place
- 1964 Port Provence Place
- 1957 Port Weybridge Place
- 2001 Port Weybridge Place
- 1972 Port Weybridge Place
- 1958 Port Provence Place
- 1966 Port Weybridge Place
- 2000 Port Weybridge Place
- 2000 Port Provence Place
- 1951 Port Weybridge Place
- 2007 Port Weybridge Place
- 1952 Port Provence Place
- 1960 Port Weybridge Place
- 2006 Port Weybridge Place
- 1975 Port Bristol Cir
- 2006 Port Provence Place
- 1967 Port Provence Place
- 1945 Port Weybridge Place