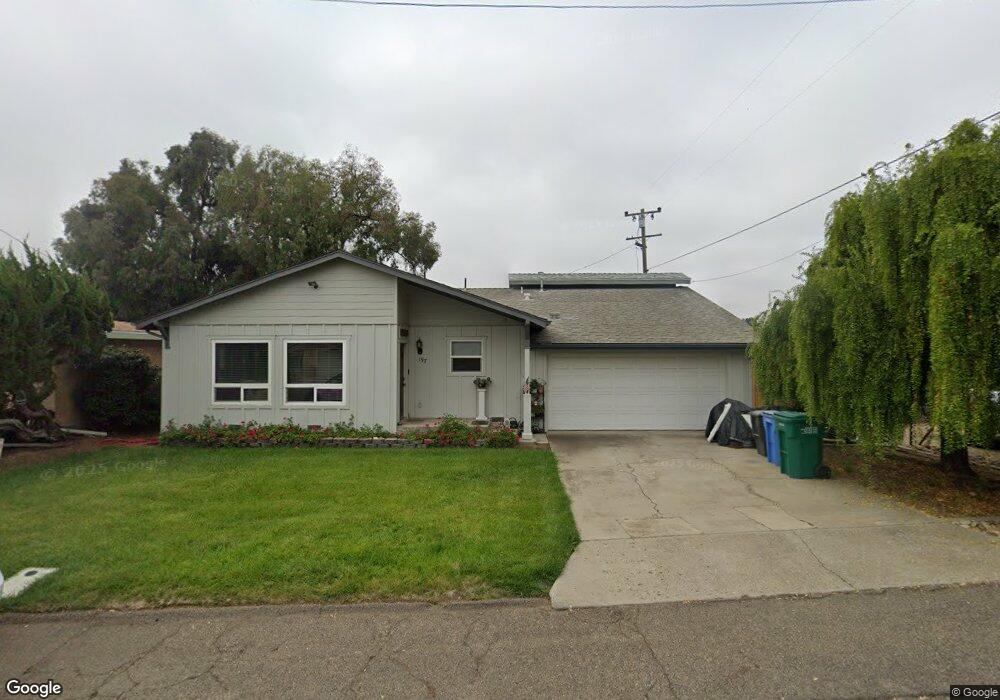
197 Kent St Nipomo, CA 93444
Estimated Value: $644,000 - $796,000
4
Beds
2
Baths
1,712
Sq Ft
$412/Sq Ft
Est. Value
About This Home
This home is located at 197 Kent St, Nipomo, CA 93444 and is currently estimated at $704,876, approximately $411 per square foot. 197 Kent St is a home located in San Luis Obispo County with nearby schools including Nipomo Elementary School, Mesa Middle School, and Nipomo High School.
Ownership History
Date
Name
Owned For
Owner Type
Purchase Details
Closed on
Aug 21, 2015
Sold by
Bolton Darrell Lynn and Bolton Tami Linn
Bought by
The Darrell Lynn Bolton & Tami Linn Bolt and Bolton Tami Linn
Current Estimated Value
Purchase Details
Closed on
Jan 13, 2006
Sold by
Bolton Darrell Lynn and Bolton Tami Linn
Bought by
Bolton Darrell Lynn and Bolton Tami Linn
Home Financials for this Owner
Home Financials are based on the most recent Mortgage that was taken out on this home.
Original Mortgage
$128,000
Interest Rate
6.32%
Mortgage Type
New Conventional
Purchase Details
Closed on
Dec 11, 1998
Sold by
Bolton Darrell Lynn and Bolton Tami Linn
Bought by
Bolton Darrell Lynn and Bolton Tami Linn
Create a Home Valuation Report for This Property
The Home Valuation Report is an in-depth analysis detailing your home's value as well as a comparison with similar homes in the area
Home Values in the Area
Average Home Value in this Area
Purchase History
| Date | Buyer | Sale Price | Title Company |
|---|---|---|---|
| The Darrell Lynn Bolton & Tami Linn Bolt | -- | None Available | |
| Bolton Darrell Lynn | -- | Chicago Title | |
| Bolton Darrell Lynn | -- | -- |
Source: Public Records
Mortgage History
| Date | Status | Borrower | Loan Amount |
|---|---|---|---|
| Closed | Bolton Darrell Lynn | $128,000 |
Source: Public Records
Tax History Compared to Growth
Tax History
| Year | Tax Paid | Tax Assessment Tax Assessment Total Assessment is a certain percentage of the fair market value that is determined by local assessors to be the total taxable value of land and additions on the property. | Land | Improvement |
|---|---|---|---|---|
| 2025 | $3,137 | $312,106 | $121,339 | $190,767 |
| 2024 | $3,099 | $305,987 | $118,960 | $187,027 |
| 2023 | $3,099 | $299,988 | $116,628 | $183,360 |
| 2022 | $3,051 | $294,107 | $114,342 | $179,765 |
| 2021 | $3,044 | $288,341 | $112,100 | $176,241 |
| 2020 | $3,009 | $285,385 | $110,951 | $174,434 |
| 2019 | $2,989 | $279,790 | $108,776 | $171,014 |
| 2018 | $2,952 | $274,305 | $106,644 | $167,661 |
| 2017 | $2,895 | $268,927 | $104,553 | $164,374 |
| 2016 | $2,729 | $263,654 | $102,503 | $161,151 |
| 2015 | $2,688 | $259,695 | $100,964 | $158,731 |
| 2014 | $2,587 | $254,609 | $98,987 | $155,622 |
Source: Public Records
Map
Nearby Homes
- 160 San Antonio Ln
- 400 N Oakglen Ave
- 449 W Tefft St Unit 23
- 449 W Tefft St Unit 13
- 255 Encino Ln
- 228 Chaparral Ln
- 412 N Mallagh St
- 719 W Tefft St
- 680 Hill St
- 759 Viola Ct
- 1 W Branch St
- Mesa Plan at Hill Street Terraces - Hill Street Series
- Pacific Plan at Hill Street Terraces - Hill Street Series
- Monarch Plan at Hill Street Terraces - Hill Street Series
- Rancho Plan at Hill Street Terraces - Hill Street Series
- Dana Plan at Hill Street Terraces - Hill Street Series
- 217 Hope Way
- 90111003 W Price St
- 777 Palmer St
- 0 S Burton St