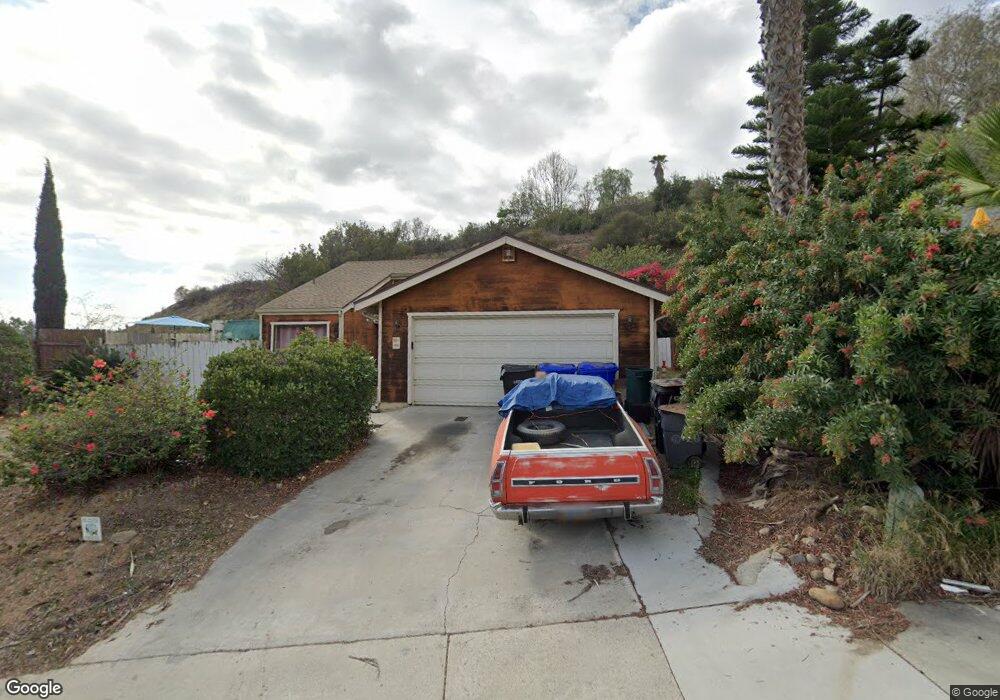
1970 Boundary St San Diego, CA 92104
North Park NeighborhoodEstimated Value: $953,680 - $1,342,000
3
Beds
2
Baths
1,349
Sq Ft
$883/Sq Ft
Est. Value
About This Home
This home is located at 1970 Boundary St, San Diego, CA 92104 and is currently estimated at $1,191,420, approximately $883 per square foot. 1970 Boundary St is a home located in San Diego County with nearby schools including McKinley Elementary School, Roosevelt International Middle School, and Mcgill School Of Success.
Ownership History
Date
Name
Owned For
Owner Type
Purchase Details
Closed on
Jan 27, 2000
Sold by
Renden Gibbs Trust 03-05-92 and Michael
Bought by
Torres Antonio and Torres Alicia T Deleon
Current Estimated Value
Home Financials for this Owner
Home Financials are based on the most recent Mortgage that was taken out on this home.
Original Mortgage
$176,800
Outstanding Balance
$57,591
Interest Rate
7.96%
Estimated Equity
$1,133,829
Purchase Details
Closed on
Dec 12, 1986
Purchase Details
Closed on
Dec 20, 1984
Create a Home Valuation Report for This Property
The Home Valuation Report is an in-depth analysis detailing your home's value as well as a comparison with similar homes in the area
Home Values in the Area
Average Home Value in this Area
Purchase History
| Date | Buyer | Sale Price | Title Company |
|---|---|---|---|
| Torres Antonio | $208,000 | Fidelity National Title | |
| -- | $125,500 | -- | |
| -- | $50,000 | -- |
Source: Public Records
Mortgage History
| Date | Status | Borrower | Loan Amount |
|---|---|---|---|
| Open | Torres Antonio | $176,800 |
Source: Public Records
Tax History Compared to Growth
Tax History
| Year | Tax Paid | Tax Assessment Tax Assessment Total Assessment is a certain percentage of the fair market value that is determined by local assessors to be the total taxable value of land and additions on the property. | Land | Improvement |
|---|---|---|---|---|
| 2025 | $3,798 | $319,663 | $92,205 | $227,458 |
| 2024 | $3,798 | $313,397 | $90,398 | $222,999 |
| 2023 | $3,712 | $307,253 | $88,626 | $218,627 |
| 2022 | $3,612 | $301,230 | $86,889 | $214,341 |
| 2021 | $3,586 | $295,325 | $85,186 | $210,139 |
| 2020 | $3,542 | $292,298 | $84,313 | $207,985 |
| 2019 | $3,477 | $286,567 | $82,660 | $203,907 |
| 2018 | $3,250 | $280,949 | $81,040 | $199,909 |
| 2017 | $80 | $275,441 | $79,451 | $195,990 |
| 2016 | $3,118 | $270,042 | $77,894 | $192,148 |
| 2015 | $3,072 | $265,986 | $76,724 | $189,262 |
| 2014 | $3,022 | $260,777 | $75,222 | $185,555 |
Source: Public Records
Map
Nearby Homes
- 2035 Haller St
- 2170 Montclair St
- 1742 Rowan St
- 1804 Colonial Ave
- 3171 3175 K St
- 441 443 N 41st St
- 348 & 350 27th St
- 2280-82 Pentuckett Ave
- 1505 Bridgeview Dr
- 2382 Haller St
- 1480 Bridgeview Dr
- 1720 Midvale Dr
- 3688 Cactusview Dr
- 2215 Marigold Place
- 3606 Maple St Unit 12
- 2609 Montclair St Unit 11
- 2541 Haller St
- 3665 Ash St Unit 7
- 1738 33rd St
- 2211 Bancroft St
- 1980 Boundary St
- 1990 Boundary St
- 2005 Montclair St
- 2012 Boundary St
- 0000 Montclair St
- 2015 Montclair St
- 2011 Haller St
- 2013 Haller St
- 2024 Boundary St
- 3637 Grape St
- 2015 Haller St Unit 1
- 2025 Montclair St
- 3630 Fir St
- 2027 Boundary St
- 2017 Haller St
- 2036 Boundary St
- 2019 Haller St
- 2021 Haller St
- 2035 Montclair St
- 3644 Grape St